
History of the Market Regime Model - Conclusion
2010 - 2025: Summing up the Market Regime model performance over the past 15+ years
History of the Market Regime Model: Part1, Part 2, Part 3, Part 4, Part 5, Part 6
I hope this historical walkthrough of the Market Regime model was helpful. While past performance never guarantees future results—which is why live tracking matters—examining how the model behaved across many distinct market environments helps illustrate its robustness and consistency over time.
Let’s quickly recap the methodology.
When the model says we are in a Bullish regime we own TQQQ, a 3x leveraged ETF of the Nasdaq-100. We hold that position until the model says we are in a Bearish regime, at which time we would sell our TQQQ position and buy GLD, a gold ETF. We would keep flip flopping between TQQQ and GLD as the model goes from Bullish to Bearish over time.
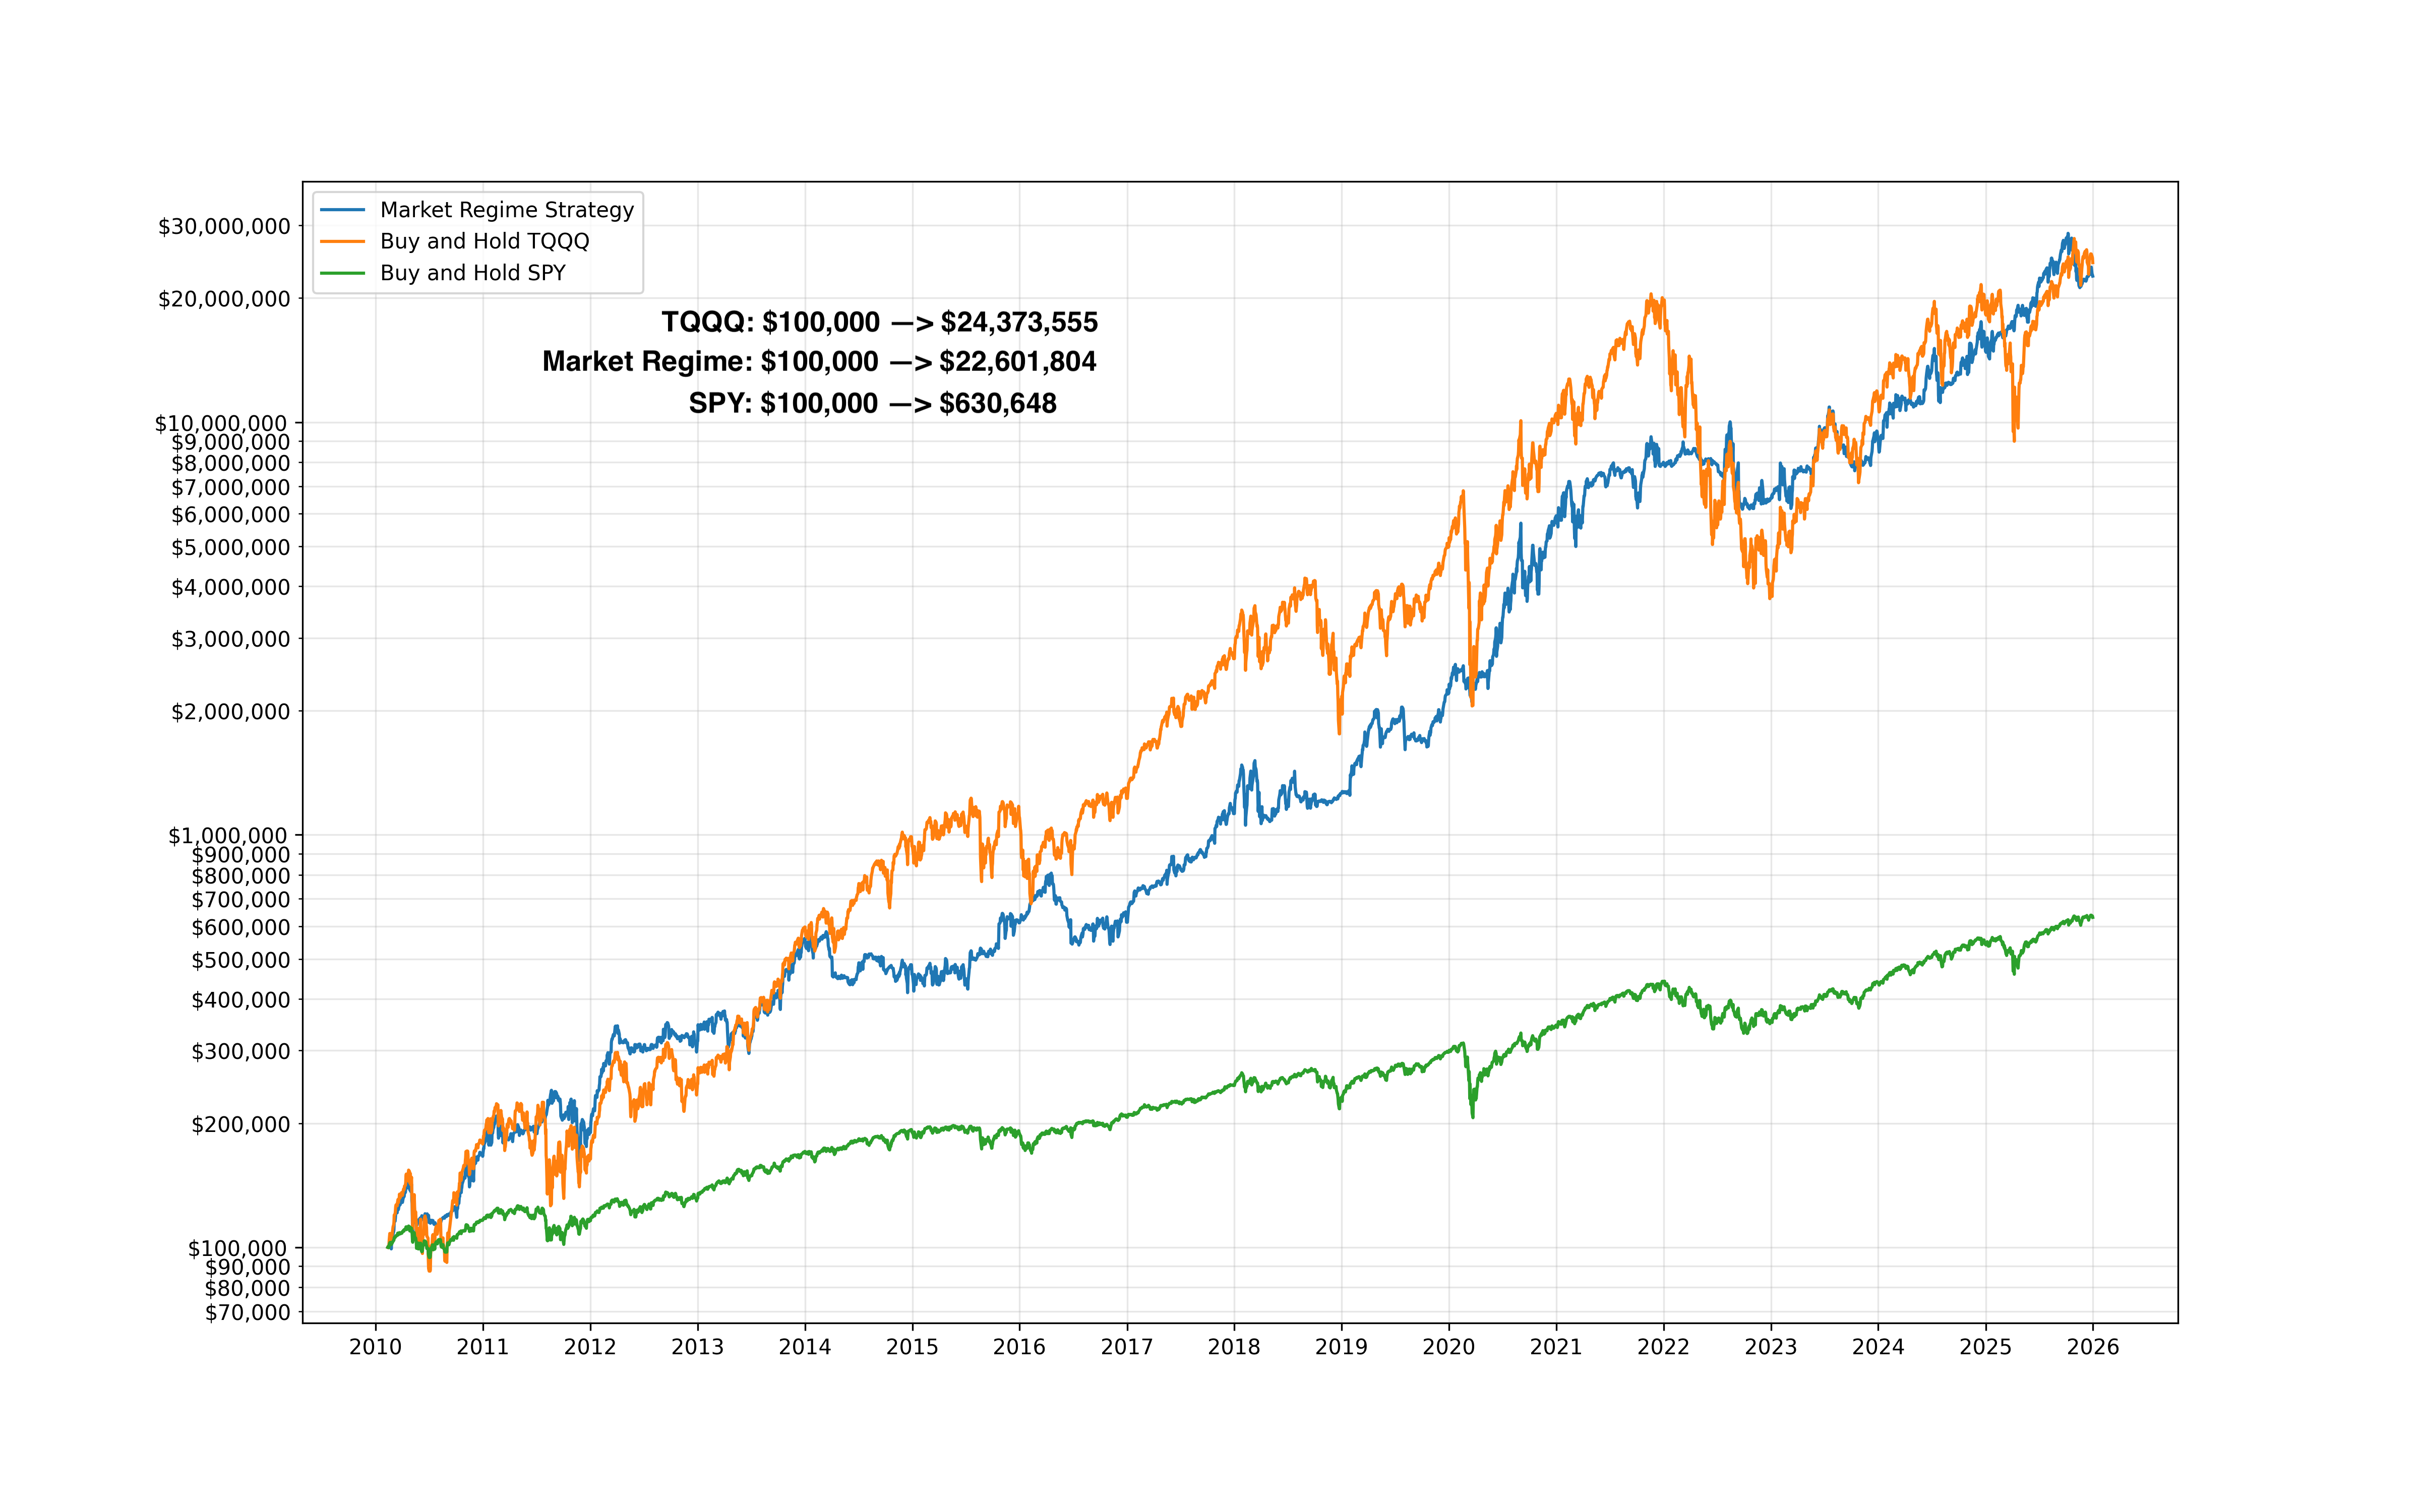
Using this simple, rules-based approach, from February 11, 2010 through December 31, 2025, the strategy turned $100,000 into roughly $22.6 million. That’s a total return of about 22,500%, which works out to an annualized return of 40.67% per year over nearly 16 years.
Those numbers alone are impressive—but numbers without context can be misleading. So let’s compare this strategy to two benchmarks most investors are familiar with: buy-and-hold TQQQ and buy-and-hold SPY.
Comparing Apples to Apples
Over the same timeframe:
Buy & Hold TQQQ
CAGR: 41.34%
Max drawdown: -81.75%
Buy & Hold SPY
CAGR: 12.29%
Max drawdown: -34.10%
Market Regime Strategy
CAGR: 40.67%
Max drawdown: -38.62%
This is where things get interesting.
From a returns perspective, the Market Regime strategy performed almost identically to simply holding TQQQ. The equity curves track each other remarkably closely over 15+ years. In other words, the strategy captured nearly all of the upside of a 3x leveraged Nasdaq ETF.
But from a risk perspective, the experience was dramatically different.
Why Drawdowns Matter (More Than Most People Think)
Holding TQQQ through the full period required enduring an 81.75% drawdown. That means at one point, your portfolio would have lost more than four-fifths of its value.
Very few investors—professional or retail—can actually stick with a strategy through that kind of loss. Even if the math says it eventually recovers, human psychology usually taps out long before the rebound.
By contrast, the Market Regime strategy’s worst drawdown was -38.62%.
That’s still uncomfortable. Drawdowns always are. But it’s much closer to the risk profile of SPY, a broad, non-leveraged market ETF, which experienced a -34.1% maximum drawdown over the same period.
Let that sink in:
The strategy delivered returns similar to holding a 3x leveraged ETF,
but with drawdowns similar to holding a traditional stock market ETF.
That is the core insight of this entire series.
Why This Matters in the Real World
Most backtests look great on paper. What matters is whether a strategy is livable.
Can you:
Stick with it during drawdowns?
Avoid panic selling?
Keep executing the rules when the headlines are scary?
Stay invested long enough for the math to work?
This is where regime-based investing shines.
Instead of riding leveraged exposure straight through every crash, the model systematically steps aside during hostile market conditions and allocates to a defensive asset. It doesn’t eliminate drawdowns—but it compresses them, making the strategy far more survivable.
That survivability is what allows compounding to do its job.
What the Month-to-Month Experience Actually Looked Like
So far, we’ve talked about long-term returns and worst-case drawdowns. But investors don’t live in 15-year charts — they live month to month.
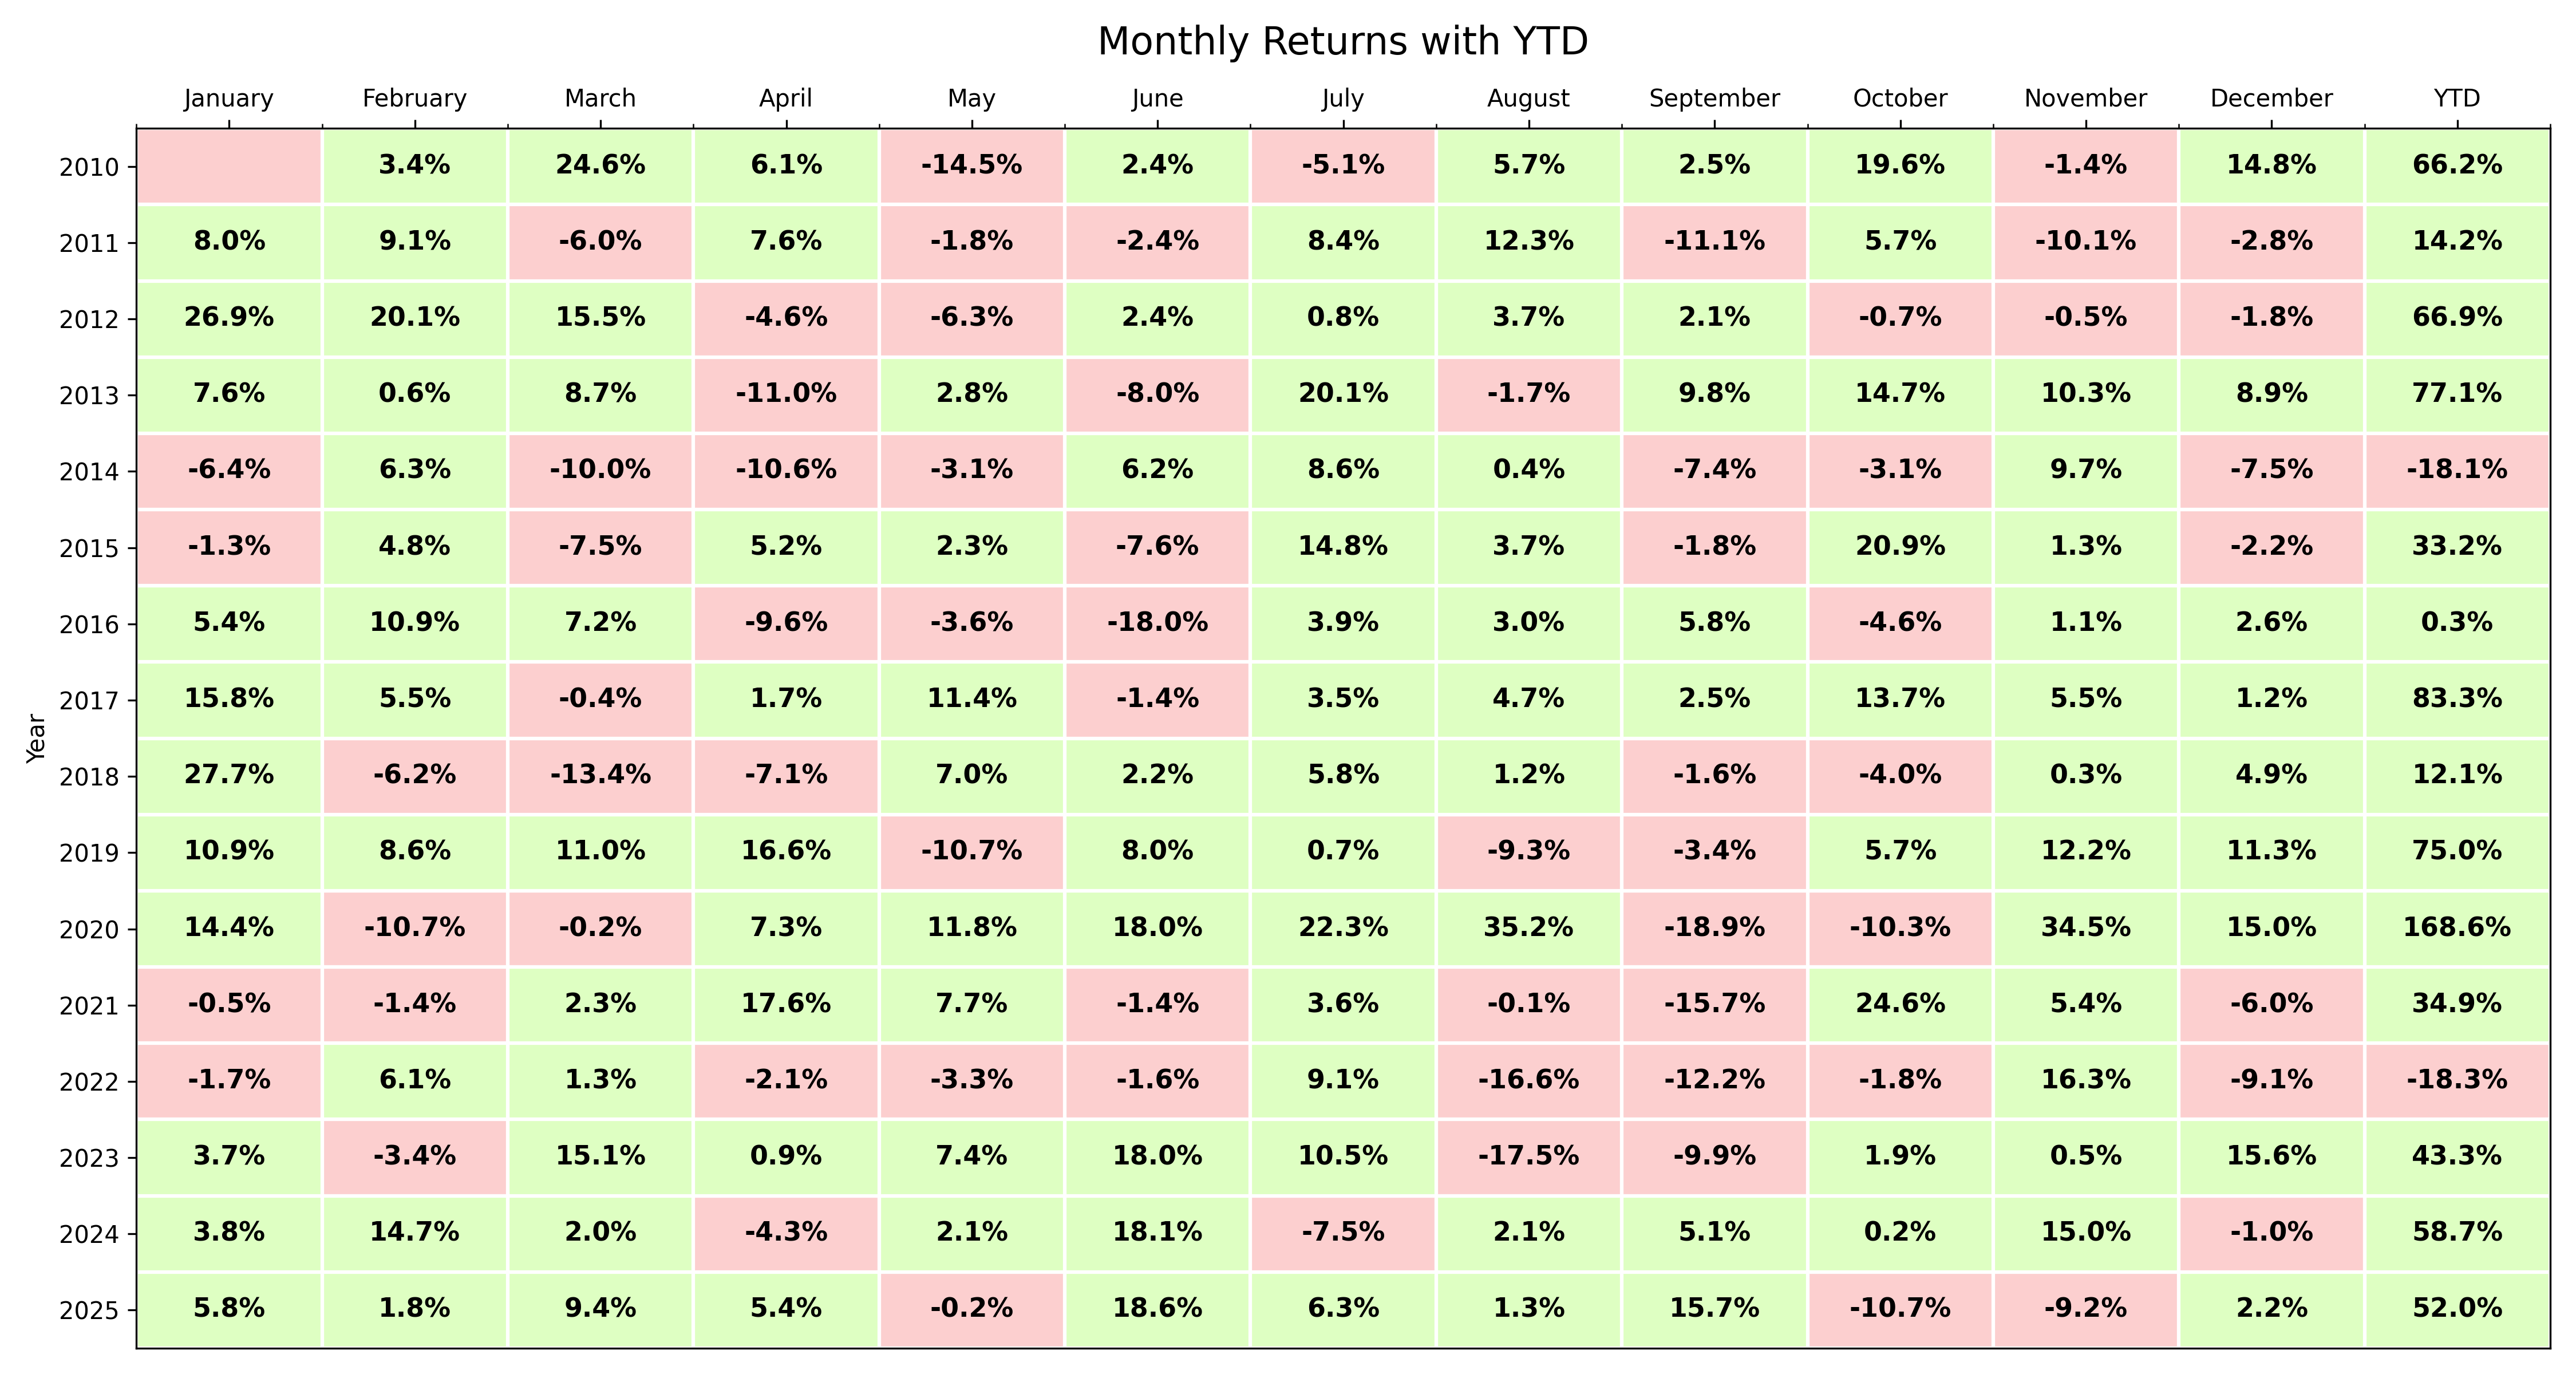
The chart above shows the monthly returns of the Market Regime strategy from 2010–2025, with green months representing gains and red months representing losses. Each row is a calendar year, and each column is a month.
A few important things stand out immediately:
Most years are dominated by many small to moderate green months, not a handful of lucky blow-off gains
63% of months are profitable with the average winning month at +8.8% and average losing month at -6.1%
Losing months do occur — that’s unavoidable — but they tend to be contained, rather than clustered into long, crushing stretches
Big negative months are relatively rare compared to what you would experience holding a leveraged ETF through bear markets
This is what risk management looks like in practice.
Instead of enduring prolonged periods of deep losses and waiting for a recovery, the regime approach aims to limit damage during hostile environments, allowing capital to compound more consistently over time.
The result is not perfection — there will always be red squares — but a return profile that is far easier to stick with psychologically.
And that’s the hidden edge most investors overlook:
the best strategy is the one you can actually stay invested in.
Final Thoughts
This historical series wasn’t meant to cherry-pick a perfect period or claim the future will look exactly like the past. Markets change. Regimes evolve. That’s precisely why I trade this model live, track it transparently, and focus obsessively on risk.
What this history does show is that:
Simple rules can outperform complex predictions
Risk management matters more than being right
And the path you take to returns is just as important as the returns themselves
If you can achieve TQQQ-like returns while experiencing SPY-like drawdowns, you dramatically improve your odds of staying invested—and staying disciplined—over the long run.
That, more than any single number on a chart, is what makes the Market Regime approach so powerful.
Thanks for following along through the full 2010–2025 history.
If you want to follow this strategy in real time, with full transparency, live signals, and ongoing performance tracking—not just hindsight—subscribe and see how the Market Regime model navigates the next cycle as it happens.
The drawdown compression is what makes this approach tradeable long-term. Most backtests ignore the psycological reality that an 80% drawdown ends careers even if the math eventually works. Matching TQQQ returns while keeping drawdowns near SPY levels changes the game entirely. The monthly heatmap really drives home how different the lived experince is vs just looking at CAGR.