
History of the Market Regime Model - Part 4 (2018-2020)
2018-2020: Trade Wars, a Fed Pivot, and the Fastest Crash in History
This article is part of a multi-part series where I walk through how the Market Regime model would have navigated different historical market environments. To keep things simple and transparent, I’m using TQQQ during Bullish regimes and GLD during Bearish regimes as proxies for how the system behaved in real time. Of course, past performance never guarantees future results—but understanding how a model responds across different conditions is exactly why I trade it live today. Seeing how it handled both calm and chaotic markets helps illustrate the consistency and robustness that make this approach so powerful.
In case you missed it, here’s links to the entire series:
Part 4
Part 4 may be the most revealing chapter in the entire history of the Market Regime model.
From 2018 through early 2020, markets were anything but stable. This period included the aftershocks of Volmageddon, escalating U.S.–China trade wars, a sharp Q4 2018 selloff, a dramatic Federal Reserve policy pivot, and finally the fastest market crash in modern history as COVID shut down the global economy.
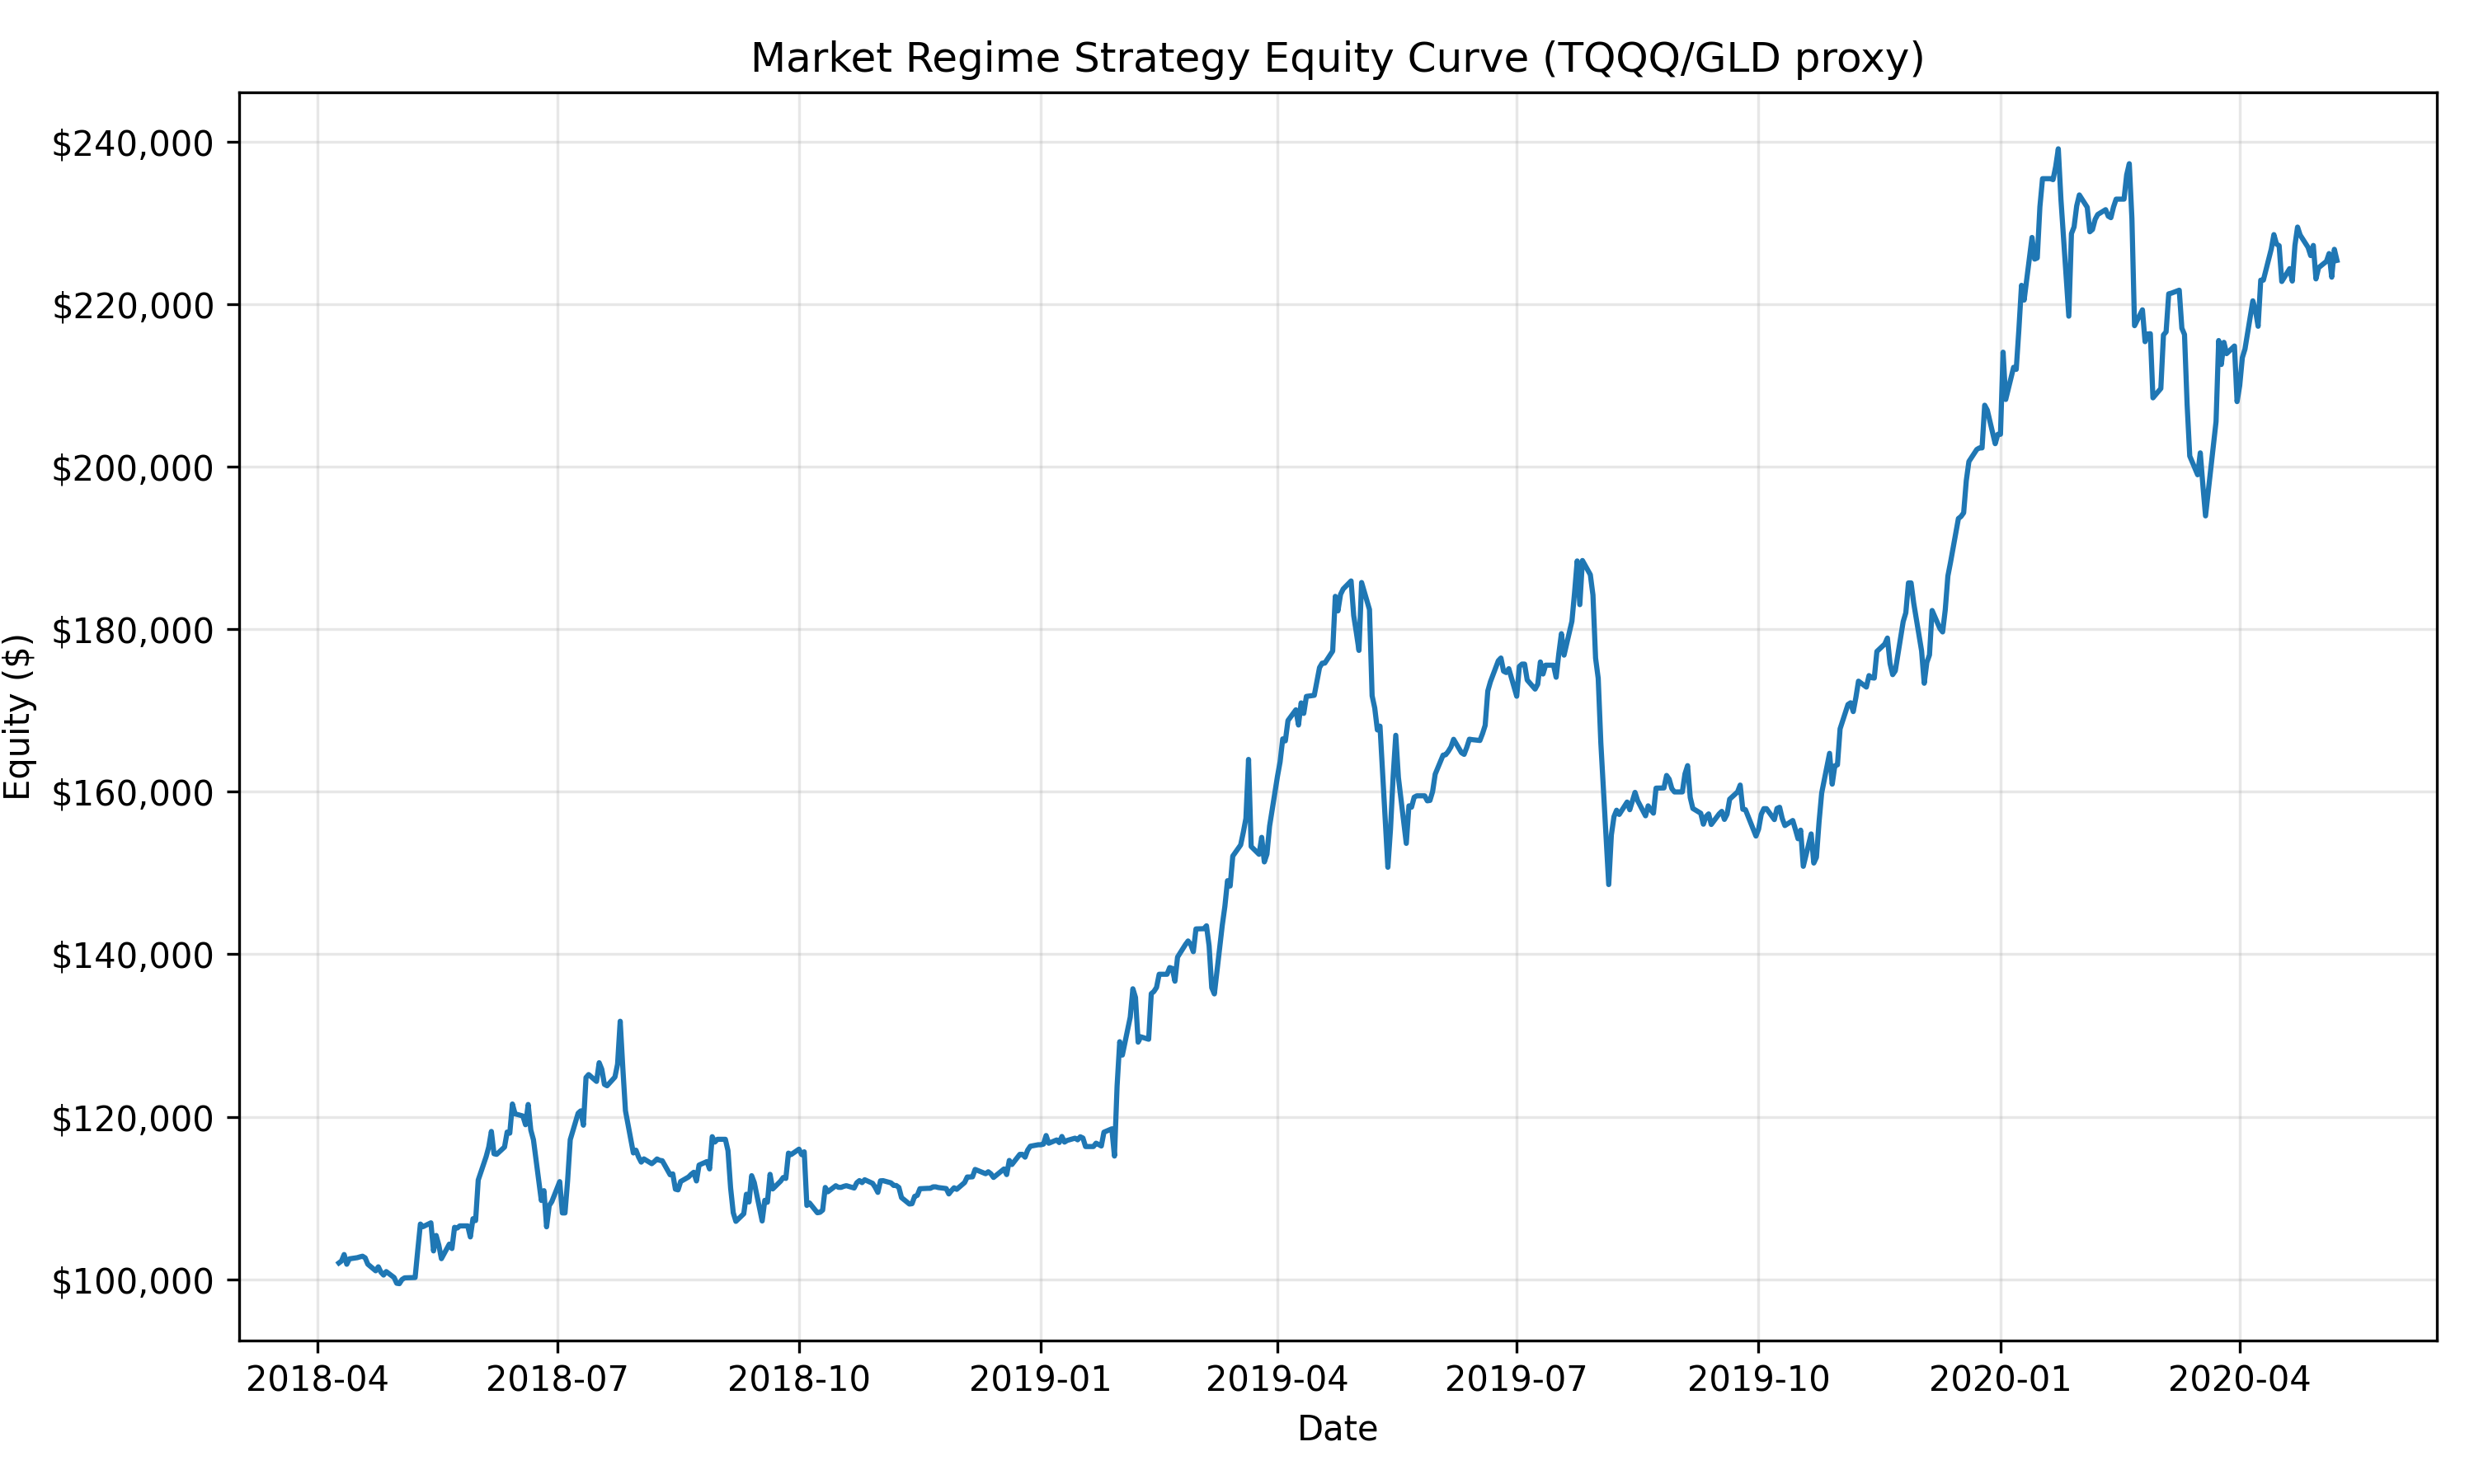
Despite that chaos, the Market Regime model delivered one of its strongest performances to date. Over this 2.1-year window, the strategy turned $100,000 into $220,989, producing a +120.99% total return, a ~46.4% CAGR, and a 53.8% win rate across 13 trades. The system responded to leadership—rotating defensively during stress and aggressively into strength when it returned.
PHASE 1 — 2018: Volatility Returns and the Trade War Era
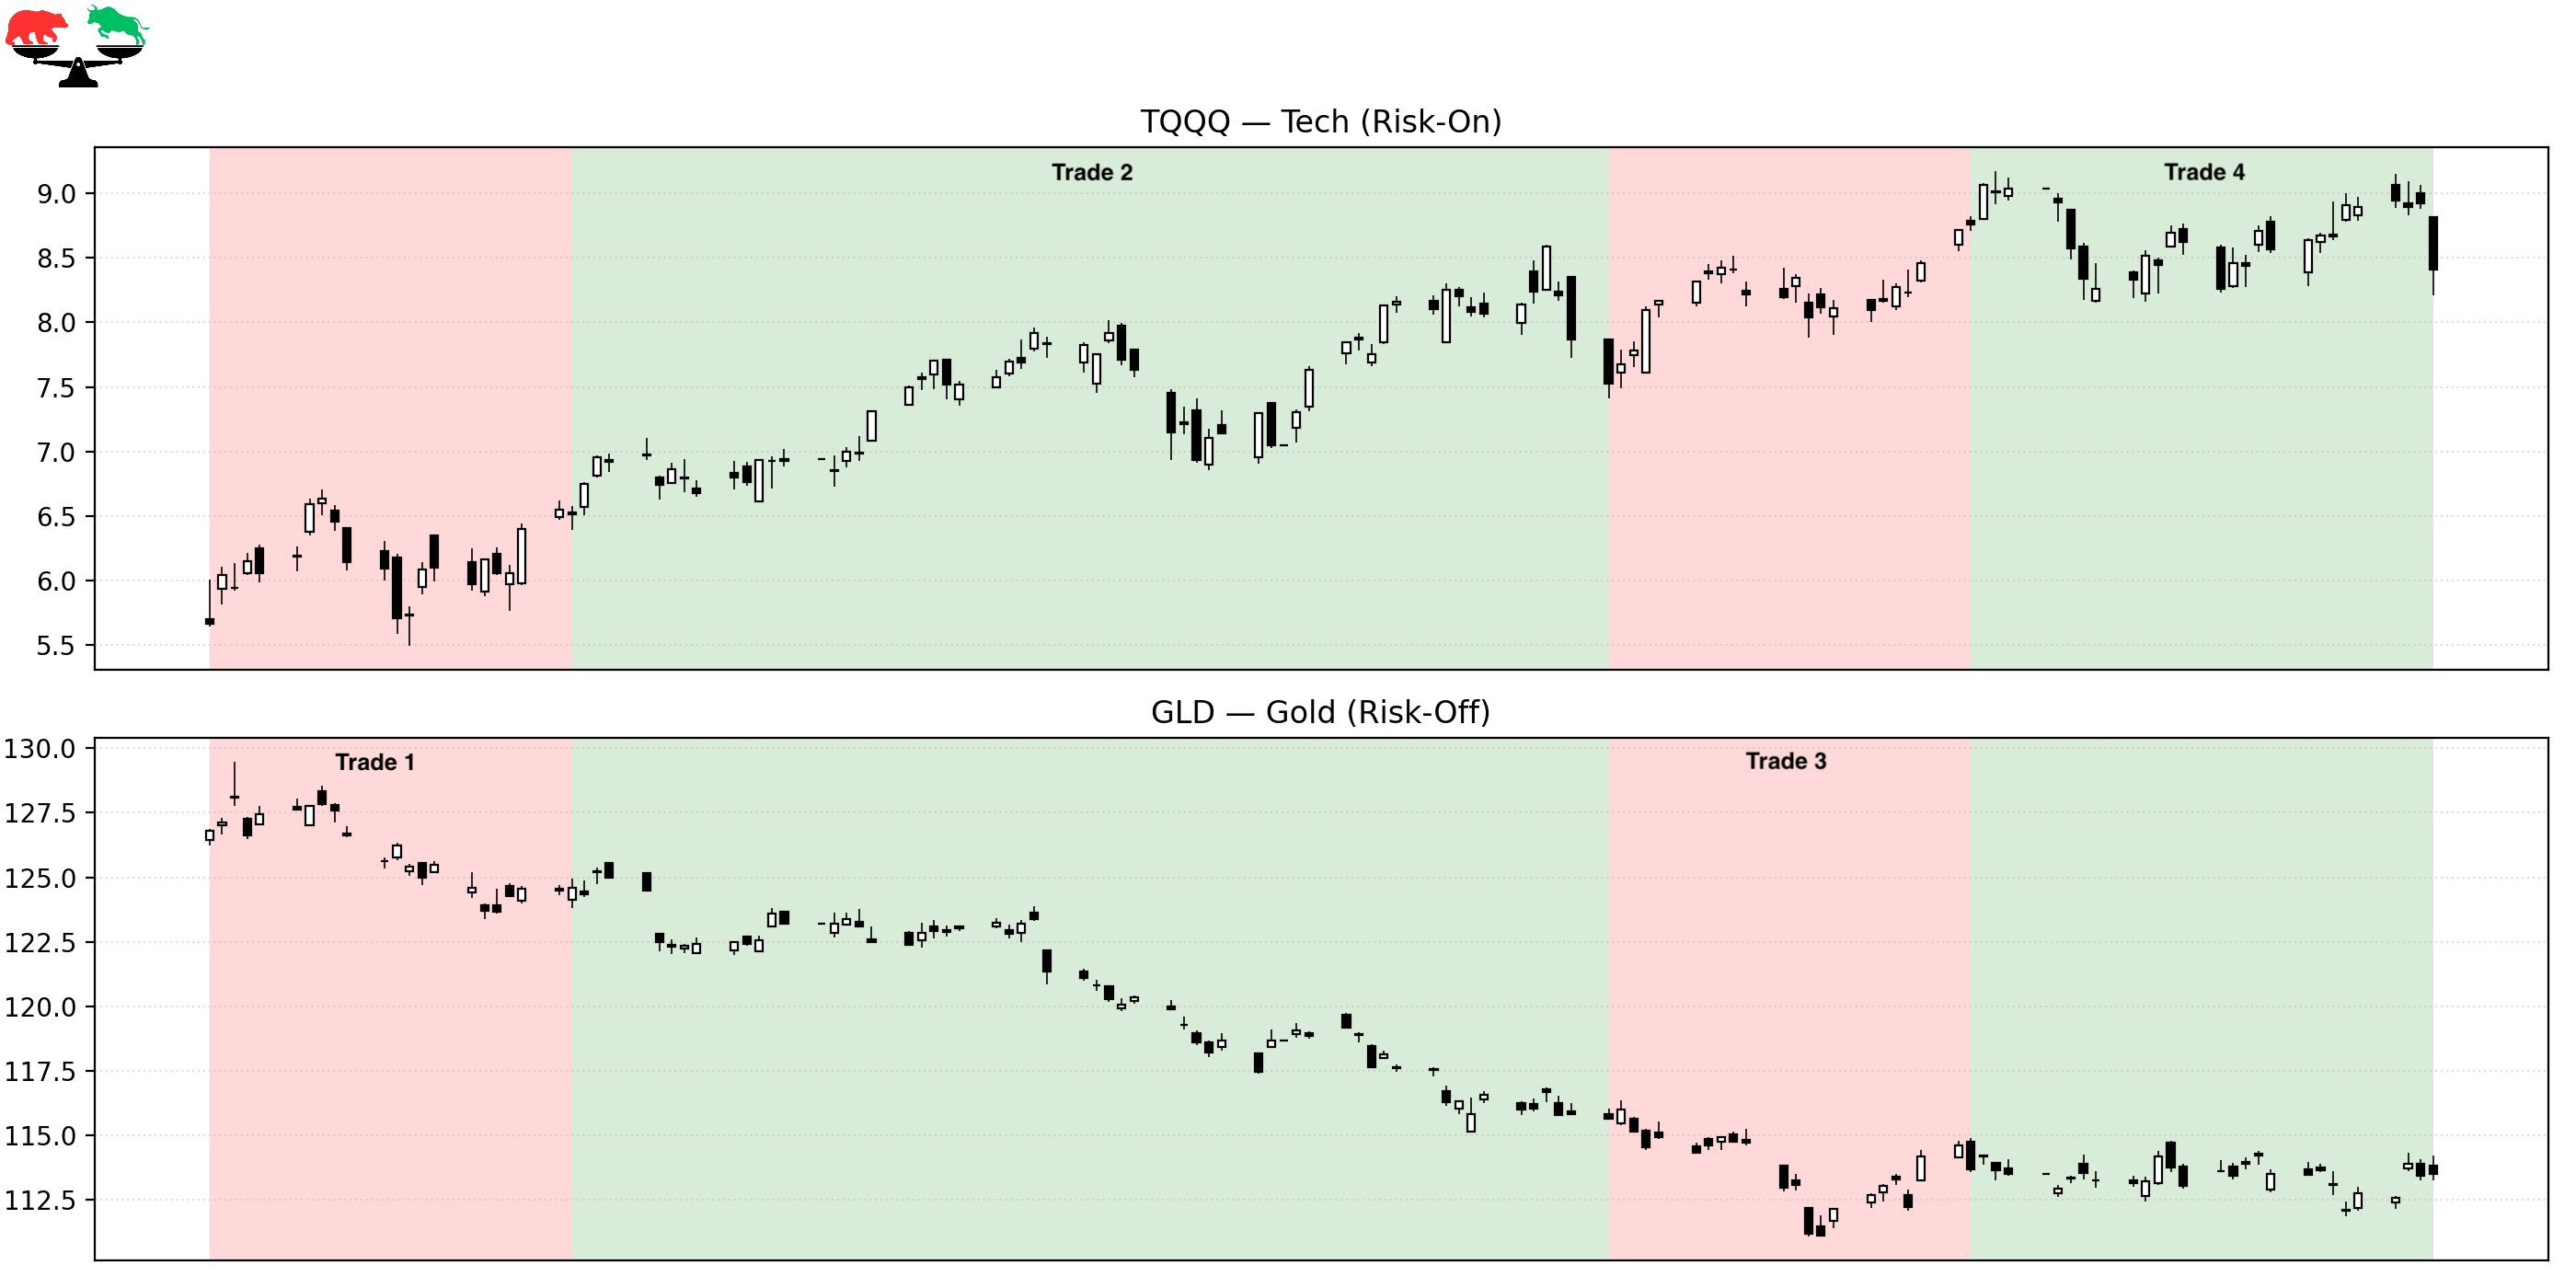
Trade 1 – Defensive After Volmageddon
Instrument: GLD
Start: 2018-04-09
End: 2018-05-08
Length: 30 days
Return: -1.76%
Following the February 2018 volatility shock, markets struggled to regain stable footing. Volatility remained elevated, correlations increased, and leadership was fragile. The model stayed defensive as risk appetite remained uncertain. Although GLD posted a small loss, the posture reflected caution in an unstable post-Volmageddon environment.
Trade 2 – Bullish Attempt in a Fragile Market
Instrument: TQQQ
Start: 2018-05-08
End: 2018-07-30
Length: 84 days
Return: +15.30%
Markets rallied into the summer as earnings remained strong and volatility briefly subsided. Despite rising trade tensions, risk-on leadership improved enough to justify bullish exposure. The model participated fully in this advance, capturing a solid upside move before conditions began to deteriorate again.
Trade 3 – Defensive Rotation as Trade Wars Escalate
Instrument: GLD
Start: 2018-07-30
End: 2018-08-28
Length: 30 days
Return: -1.70%
As tariff headlines intensified and global growth concerns mounted, market leadership weakened. Price action became choppier and less reliable. The regime flipped defensively, prioritizing capital preservation during an increasingly headline-driven environment.
Trade 4 – A Failed Bullish Re-Engagement
Instrument: TQQQ
Start: 2018-08-28
End: 2018-10-04
Length: 38 days
Return: -3.95%
Markets attempted another bullish push into early Q4, but the effort quickly failed. Financial conditions tightened, rates rose, and volatility surged. This trade marked the early stages of what would become the brutal Q4 2018 selloff.
PHASE 2 — Late 2018: The Q4 Waterfall
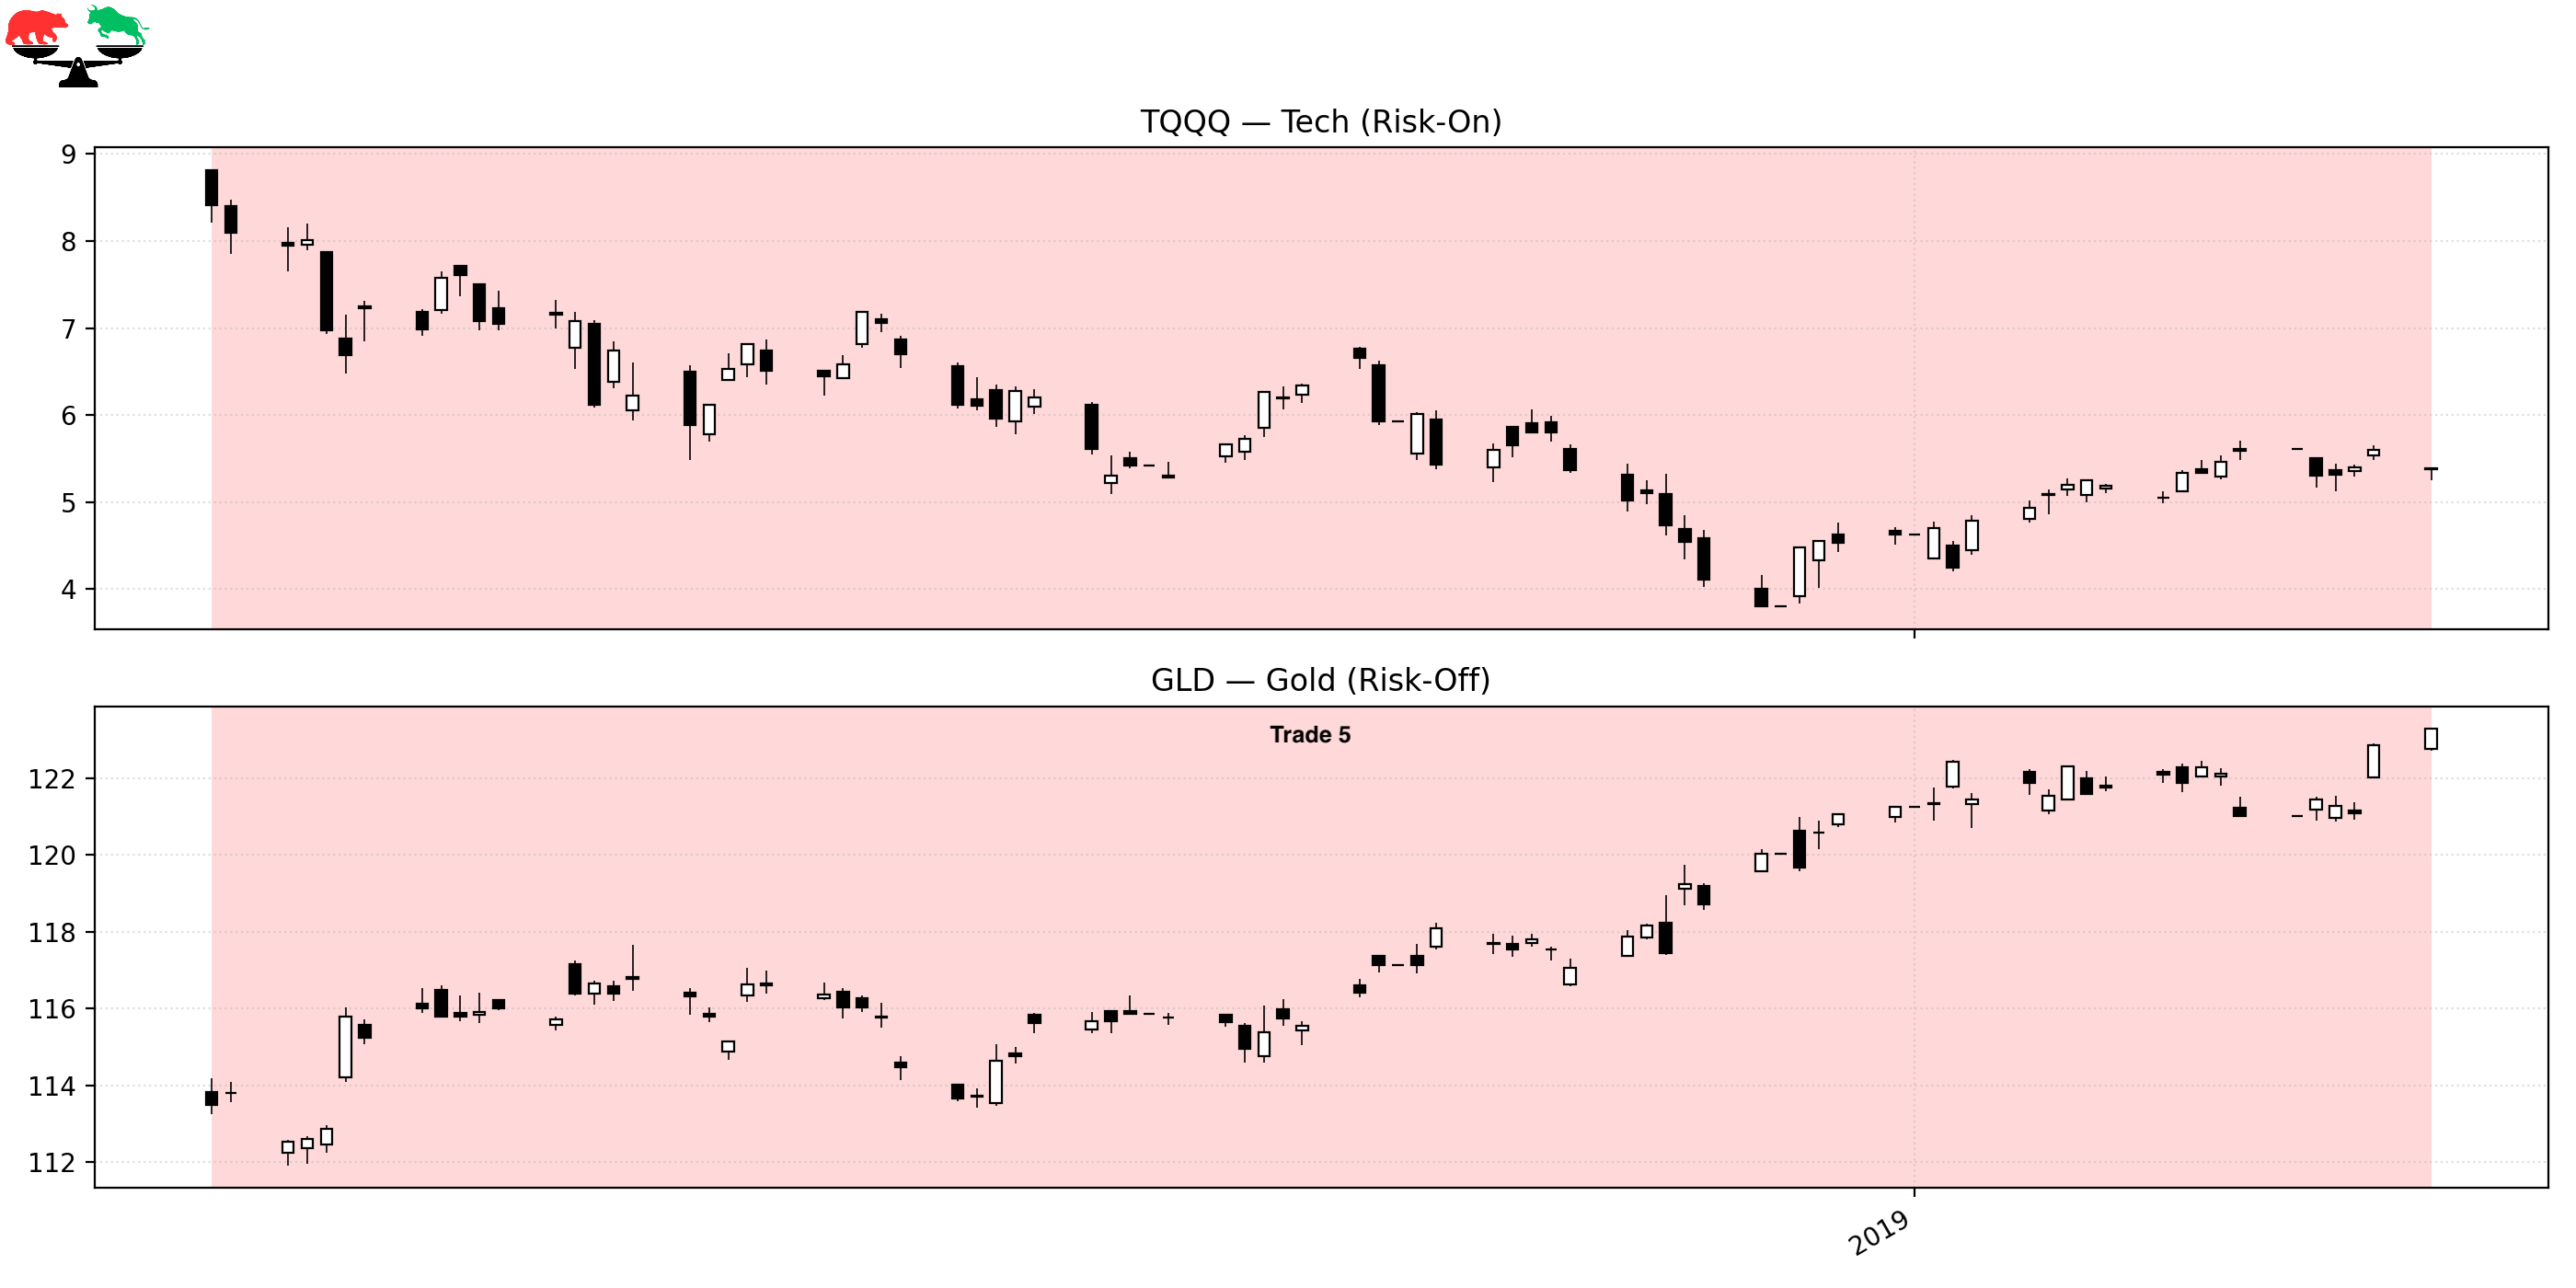
Trade 5 – Defensive Into the Q4 2018 Crash
Instrument: GLD
Start: 2018-10-04
End: 2019-01-28
Length: 117 days
Return: +8.64%
Q4 2018 delivered one of the sharpest equity drawdowns since the financial crisis. Liquidity dried up, sentiment collapsed, and markets plunged into Christmas Eve. The model remained defensive throughout the decline, avoiding catastrophic equity exposure while GLD provided meaningful positive return during a period of extreme stress.
PHASE 3 — 2019: The Fed Pivot and the Relentless Recovery
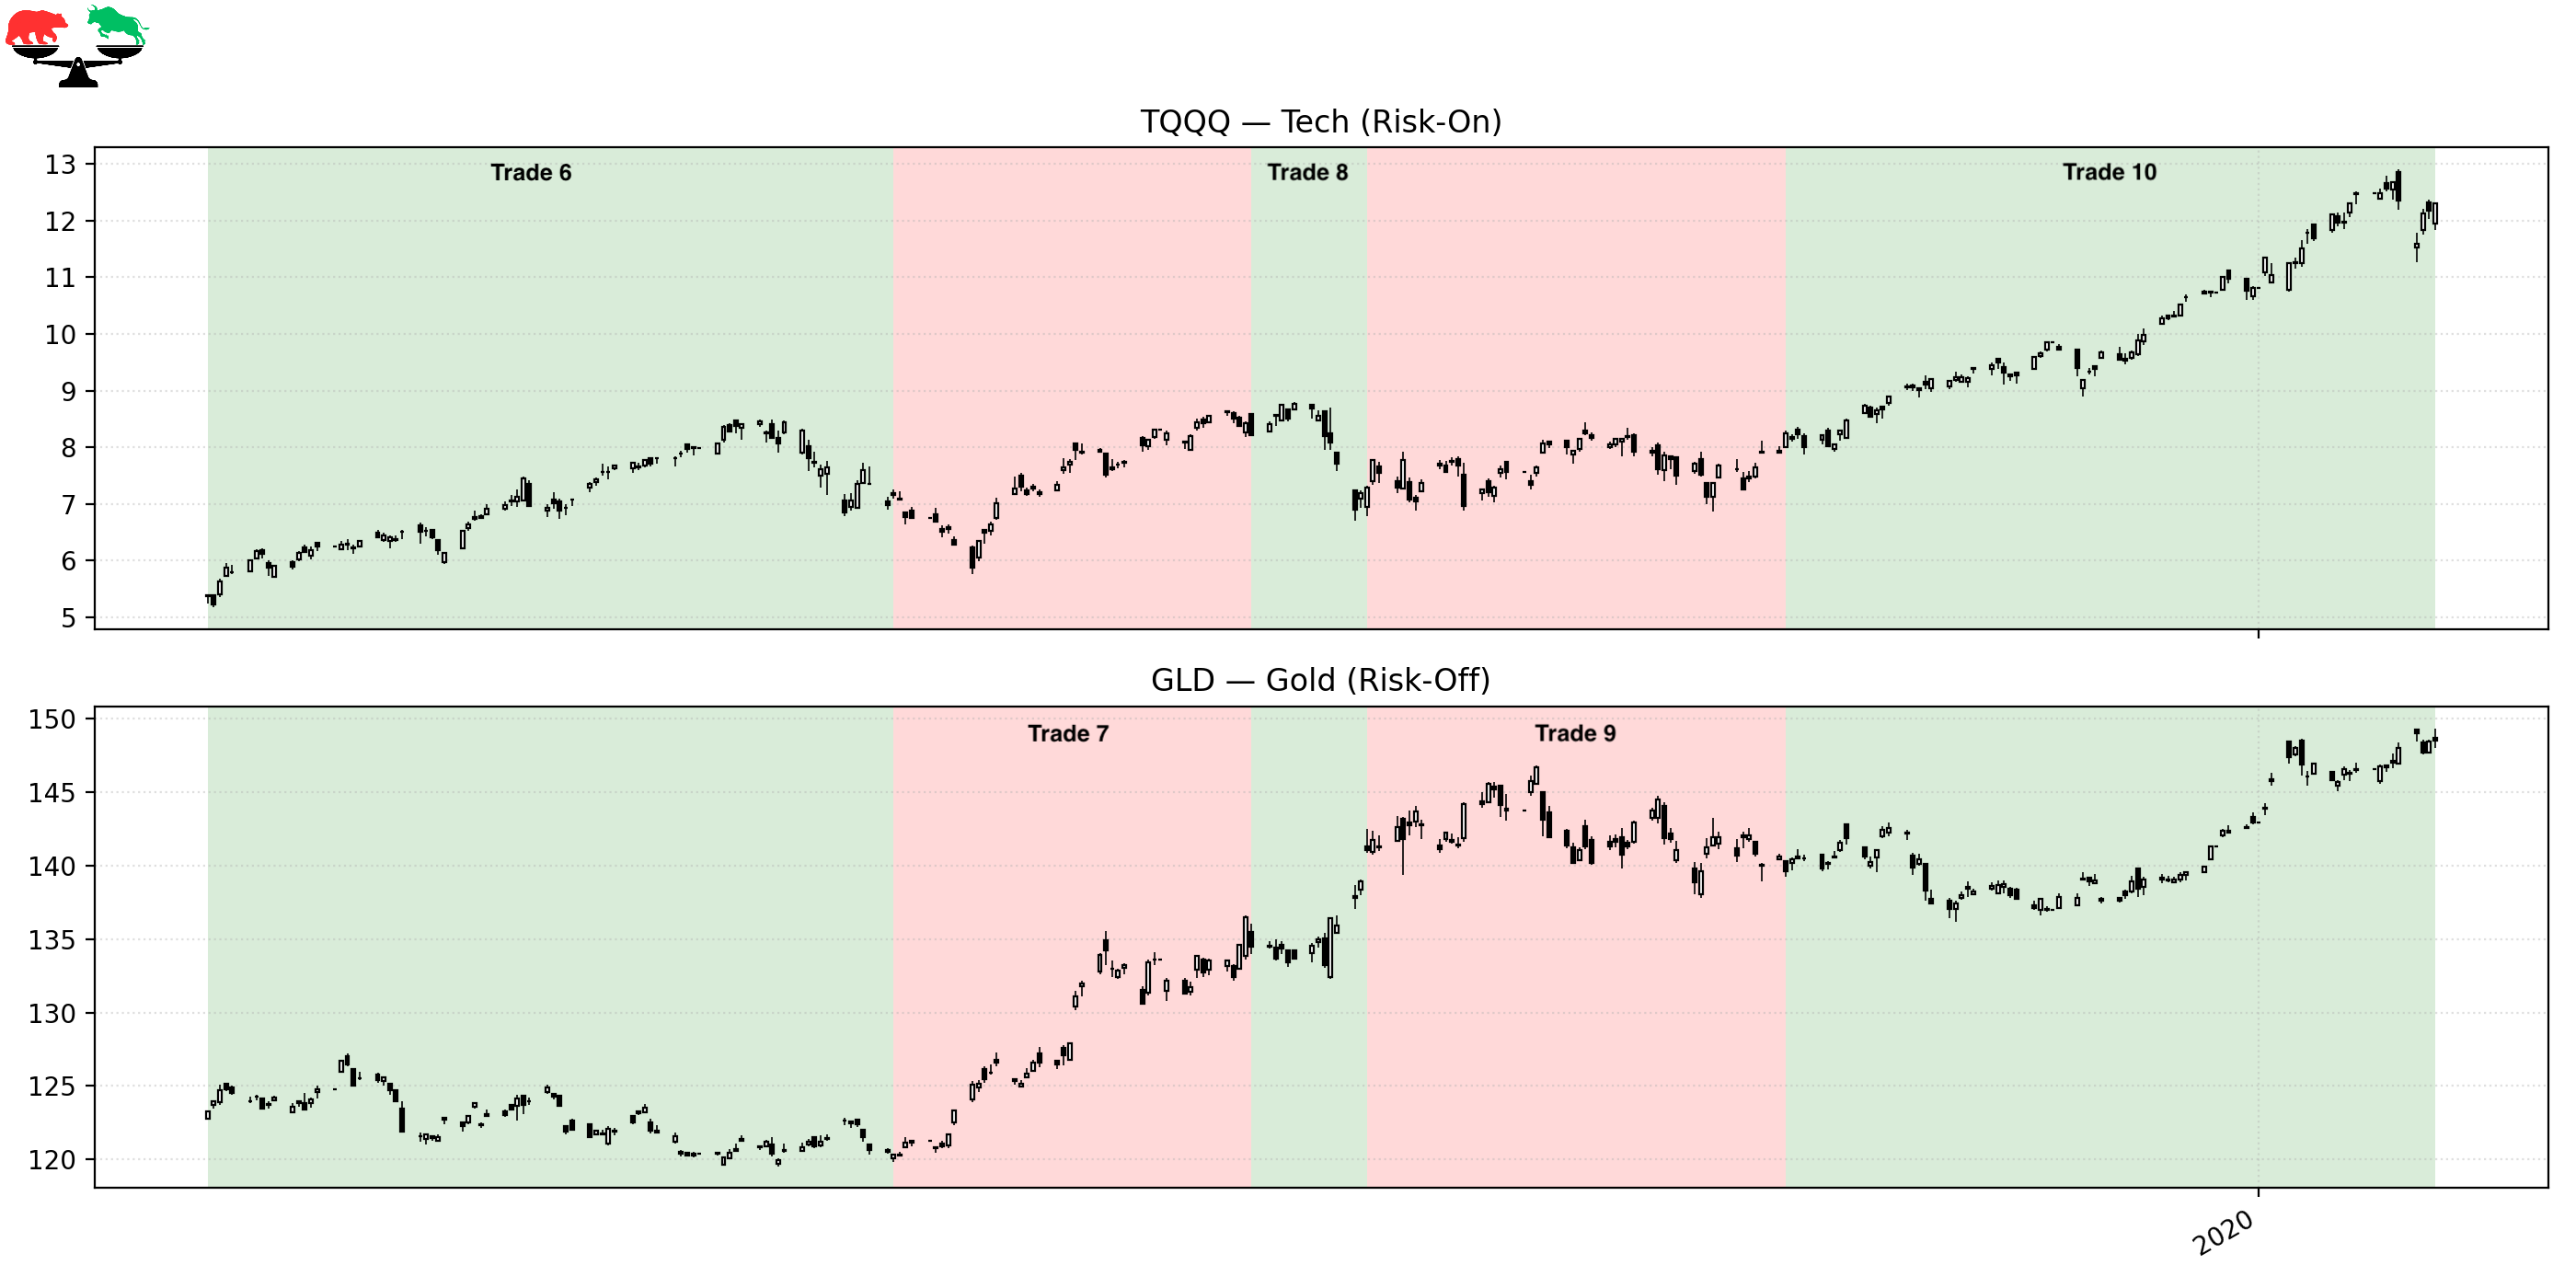
Trade 6 – Re-Entering After the Fed Pivot
Instrument: TQQQ
Start: 2019-01-28
End: 2019-05-21
Length: 114 days
Return: +33.54%
In early 2019, the Federal Reserve abruptly pivoted away from tightening, signaling patience and flexibility. Markets responded immediately. Risk assets surged, volatility collapsed, and leadership became clear. The regime model re-entered TQQQ early and captured one of the strongest upside moves of the year.
Trade 7 – Defensive Pause During Mid-2019 Uncertainty
Instrument: GLD
Start: 2019-05-21
End: 2019-07-19
Length: 60 days
Return: +11.72%
Trade tensions resurfaced mid-year, and global growth concerns returned. Leadership weakened enough to warrant a defensive rotation. This trade provided strong positive return while markets chopped sideways, highlighting the benefit of stepping aside during uncertainty.
Trade 8 – Short-Lived Bullish Exposure
Instrument: TQQQ
Start: 2019-07-19
End: 2019-08-07
Length: 20 days
Return: -11.24%
A brief bullish signal emerged, but the rally failed quickly. Volatility spiked and markets sold off sharply in early August. This trade reflects the difficulty of navigating short-term instability within a broader bull market. A big loss for the model, but part of the price paid for staying systematic rather than predictive.
Trade 9 – Defensive Rotation as Volatility Persists
Instrument: GLD
Start: 2019-08-07
End: 2019-10-15
Length: 70 days
Return: -1.00%
Markets stabilized but failed to produce sustained leadership. The model remained defensive, minimizing risk exposure during a noisy consolidation phase. While returns were flat, volatility avoidance was the primary objective.
Trade 10 – Riding the Late-Cycle Melt-Up
Instrument: TQQQ
Start: 2019-10-15
End: 2020-01-30
Length: 108 days
Return: +49.39%
This was one of the most powerful trades of the period. Markets surged to all-time highs as liquidity remained abundant and volatility stayed suppressed. Sentiment grew increasingly euphoric, and the model stayed fully invested, capturing nearly a 50% gain during the final leg of the pre-COVID melt-up.
PHASE 4 — 2020: The World Shuts Down
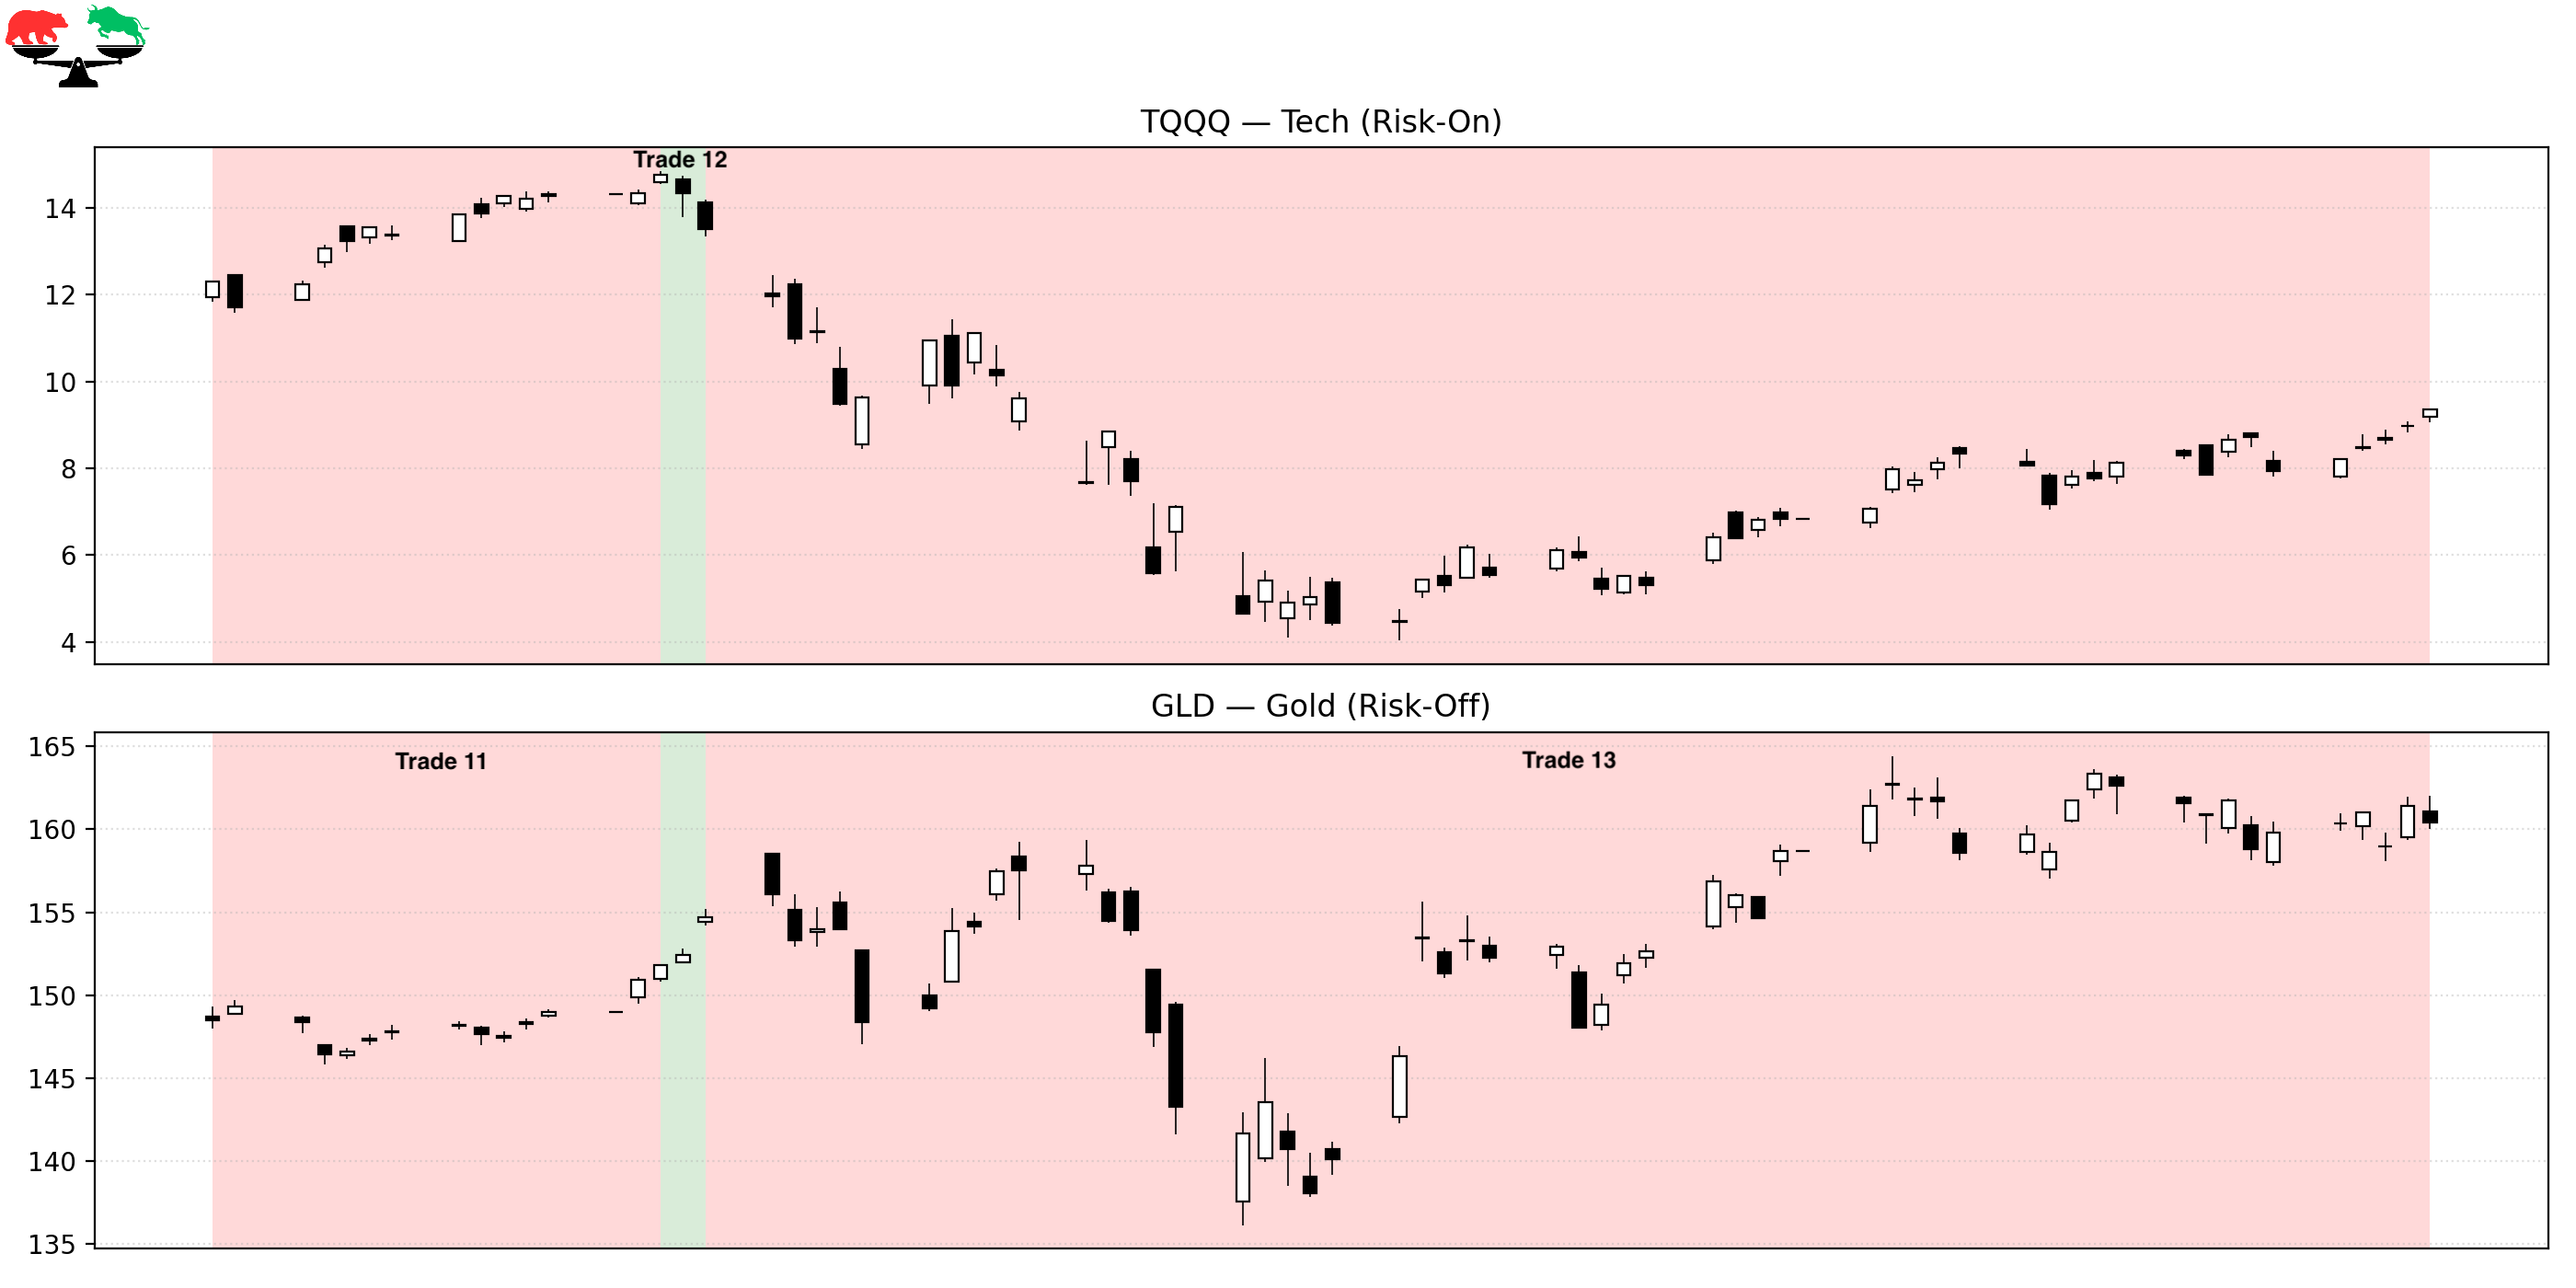
Trade 11 – Defensive Ahead of the Storm
Instrument: GLD
Start: 2020-01-30
End: 2020-02-19
Length: 21 days
Return: +2.24%
As early warnings around COVID began emerging, market leadership subtly weakened. The model rotated defensively just ahead of the collapse. This shift would prove critical.
Trade 12 – A Brief Bullish Whipsaw
Instrument: TQQQ
Start: 2020-02-19
End: 2020-02-21
Length: 3 days
Return: -8.40%
A short-lived bullish flip occurred just before markets collapsed. Within days, equities entered freefall. This trade highlights how rapidly conditions deteriorated as COVID fears became reality.
Trade 13 – Defensive Through the COVID Crash
Instrument: GLD
Start: 2020-02-21
End: 2020-05-08
Length: 78 days
Return: +3.70%
This is the defining trade of the entire period. As COVID spread globally, borders closed, economies shut down, and markets plunged at record speed. Circuit breakers triggered repeatedly, liquidity evaporated, and fear dominated every headline.
And yet, the Market Regime model was not exposed to leveraged equities. It was already defensive—and while the world felt like it was coming apart and markets were collapsing, the system made money. The article ends on May 8, 2020, the day the regime flipped again, marking the transition from crisis into recovery.
FINAL THOUGHTS
Here’s a recap of the trades taken during this period:
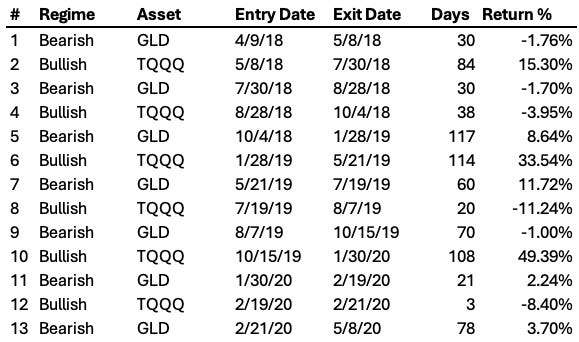
The 2018–2020 period punished emotion, prediction, and overconfidence. Markets were driven by policy mistakes, geopolitical tension, sudden reversals, and ultimately a once-in-a-century global shutdown. The Market Regime model did not avoid whipsaws, and it experienced drawdowns—just as any strategy does. By rotating defensively during genuine stress and aggressively participating when leadership returned, the system delivered a +120.99% total return, and a ~46.4% CAGR during one of the most extreme environments in market history. When markets were plunging and the world was in chaos, the model stayed systematic—and came out ahead.
Coming Next: 2020-2022 — Stimulus, Speculation, and the Inflation Shock
Part 5 begins immediately after the COVID crash, as unprecedented stimulus ignites one of the most explosive rallies ever recorded. We’ll cover the post-COVID melt-up, speculative excess, meme stocks, inflation, and the aggressive rate-hike cycle that followed—pushing the Market Regime model into a completely new era.
These historical reports show how the model handled the past.
Paid subscribers get to see how it handles the present.
If you want the same clarity in your trading today that this model brought to 2018-2020, join the paid community and follow along in real time.