Most trading strategies look great when you summarize them with one number.
A single chart, a single "CAGR," a single equity curve.
But real investing isn't lived in a single number. It's lived in the uncomfortable stretches — the drawdowns, the flat periods, and the moments when you wonder whether a strategy has stopped working.
That's why I recently did a deep dive and asked a more important question:
Is the Market Regime model's edge durable, or is it dependent on a small number of lucky trades and favorable timing?
Below is a plain-English walkthrough of the analysis I ran, the actual numbers, and what they imply — both the good and the uncomfortable.
The Objective: Durability, Not Perfection
The Market Regime model is not designed to be right all the time. It's designed to do three things:
- Limit downside during unfavorable environments
- Stay invested long enough to benefit from strong trends
- Avoid catastrophic drawdowns that permanently impair capital
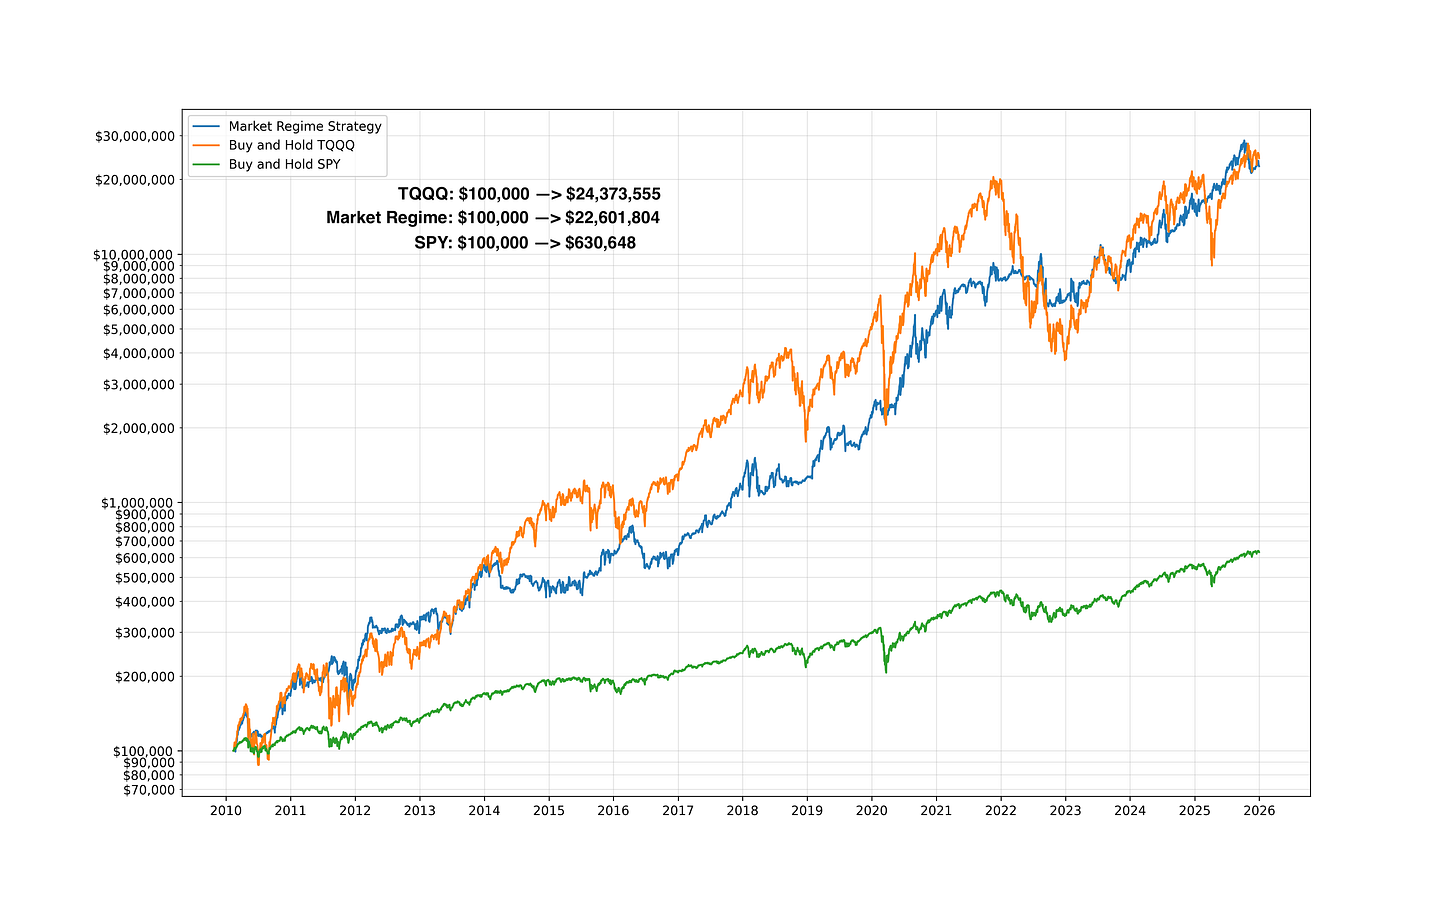
In practice, this means rotating exposure between risk-on assets (such as TQQQ) and defensive assets (such as GLD) based on regime conditions.
But a fair and necessary question is:
"Are the historical results driven by a consistent edge — or by a few outsized wins?"
That's what the following tests are meant to answer.
Two Core Metrics: Expectancy and Profit Factor
Before we get into rolling charts and simulations, we need two simple concepts.
1) Expectancy: "What do I make on average per trade?"
Expectancy measures the average outcome per trade, combining both winners and losers.
It answers the most practical question in trading:
If I take this trade over and over, what does one trade typically contribute?
Using the full historical trade set:
- Win rate: 55.7%
- Average winning trade: +17.9%
- Average losing trade: −4.4%
From this, the strategy's historical expectancy comes out to:
+8.0% per trade
Plain English: On average, each trade added roughly 8% before compounding. That's a strong edge — but only if it's not coming from a few extreme outliers.
2) Profit Factor: "How much do I make for every $1 I lose?"
Profit factor compares all winning trades to all losing trades.
- Profit factor = total gains ÷ total losses
- If profit factor is 1.0, you're breaking even.
- If it's above 1.0, you're profitable.
- The higher it is, the better the payoff balance is.
For the Market Regime model:
Historical profit factor: 5.16
Plain English: For every $1 lost, the strategy historically made about $5.16. This indicates strong asymmetry between gains and losses — an essential trait for long-term compounding.
The Reality Check: Performance Can Be "Lumpy"
Even a strategy with strong average performance can be psychologically difficult to follow.
Returns don't arrive smoothly. They tend to come in clusters:
- long stretches of modest or flat results
- followed by shorter periods of strong gains
This is extremely common in trend-following and regime-based systems.
To understand whether the edge persists through time — rather than appearing only in one lucky period — I examined rolling performance metrics.
Rolling Expectancy: Watching the "Edge" Move Over Time
Rolling expectancy measures expectancy over a small window of trades (in this case, 10 trades at a time), sliding forward through the history.
Think of it as checking fuel efficiency every 10 miles instead of only at the end of a road trip.
Why this matters
If a strategy only works in one special era (say, 2020–2021), rolling expectancy will expose that. You'll see a long stretch where expectancy is great... and then long stretches where it collapses.
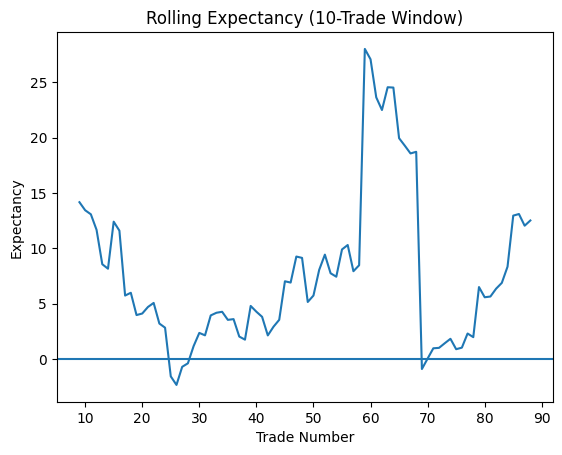
What the rolling expectancy shows
- Expectancy fluctuates over time — as expected
- There are periods where expectancy compresses, and even briefly turns negative
- These periods are generally short-lived
- Expectancy tends to recover as regimes shift
Plain English: The edge is not constant, but it also does not appear to "break." The strategy experiences normal cycles of expansion and contraction, which is exactly what you would expect from a regime-based approach.
Rolling Profit Factor: "Do We Still Win Bigger Than We Lose?"
Next, I looked at rolling profit factor.
This matters because there are two ways a strategy can have a rough stretch:
- It starts losing more often
- It starts losing big relative to its wins
Those are very different problems.
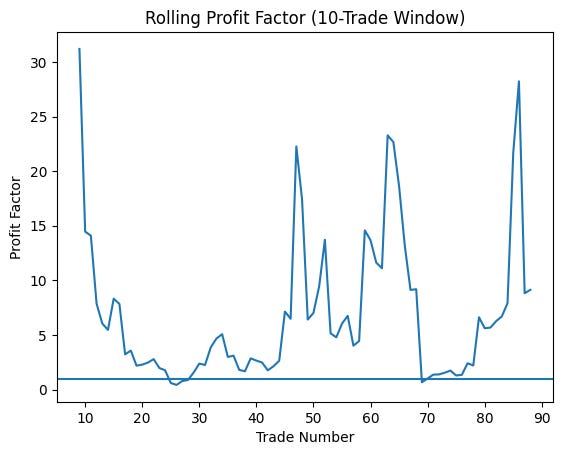
What this tells us
- Profit factor remains above 1 most of the time
- It spikes during strong trend environments
- It declines during choppier, transitional periods
Plain English: Even during weaker stretches, losses generally remained controlled relative to gains. Drawdowns may occur, but the strategy does not show signs of a runaway loss profile.
The Toughest Test: "Is This Just a Few Lucky Trades?"
This is the criticism every strategy deserves:
"Maybe you just had a couple massive winners and everything else was average."
So we stress-tested expectancy in two ways.
Stress Test #1: Removing the Biggest Winners
A common critique of backtests is that a few large trades do all the heavy lifting.
To test this, I recalculated expectancy after removing the largest winners.
Results
- Baseline expectancy: +8.0% per trade
- Without top 5 trades: +4.0% per trade
- Without top 10 trades: +2.0% per trade
Plain English: The edge shrinks — as it should — but it does not disappear. This suggests the strategy is not dependent on a handful of extreme outcomes.
Stress Test #2: Monte Carlo Simulation (Trade Order Risk)
Even if a strategy is profitable overall, the order of wins and losses can dramatically affect real-world experience.
To test this, I ran a Monte Carlo simulation:
- The same set of trades was randomly reordered 1,000 times
- Expectancy was recalculated for each simulation
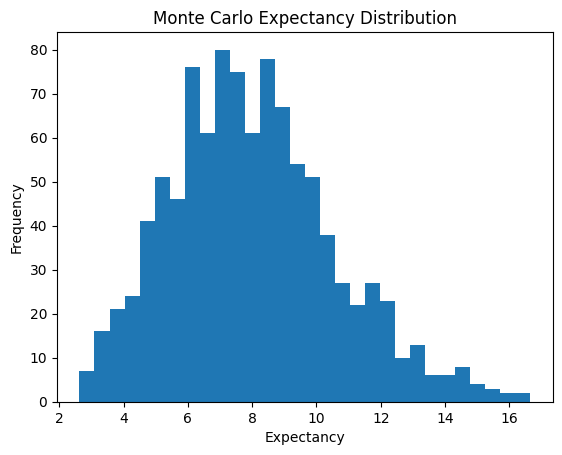
What the simulation shows
- The expectancy distribution remains centered well above zero
- There is no reliance on one "perfect" trade sequence
- Even unfavorable orderings maintain positive expectancy
Plain English: The strategy's edge does not depend on getting lucky early or experiencing a specific sequence of trades.
The Part That Matters Most: Drawdowns Are Still Real
None of this analysis removes the reality of drawdowns.
Even a robust strategy can experience:
- multi-month periods of stagnation
- sharp pullbacks during regime transitions
- emotionally difficult stretches where confidence is tested
If leverage is introduced, these periods can feel even more intense.
This is not a flaw — it's the cost of participating in markets.
The purpose of this analysis is not to promise comfort. It's to show that the discomfort has historically been survivable.
What This Analysis Supports — and What It Doesn't
What it supports
- The edge appears distributed across time
- Performance is not driven by a small number of outliers
- Losses remain controlled relative to gains
- The model behaves as expected across multiple environments
What it does not guarantee
- That future results will match historical outcomes
- That drawdowns won't deepen
- That market structure won't change
- That following the model will feel easy
Past performance is evidence, not assurance.
Why I'm Sharing This
Anyone can show a chart that goes up.
I care more about showing:
- how the model behaves when conditions are unfavorable
- what stress looks like in the numbers
- why discipline and position sizing matter
Systematic strategies tend to fail not because they stop working — but because they're abandoned during their most uncomfortable periods.
Understanding that upfront is critical.
Bottom Line
This analysis doesn't say, "The strategy is unstoppable."
It says something better:
The edge appears real, measurable, and not overly dependent on luck — but the path can be lumpy, and drawdowns will test you.
That's the honest deal.
If you're looking for something that feels good every week, this probably isn't it. If you're looking for something that prioritizes survival, discipline, and long-run compounding, then this is exactly the kind of behavior you want to see in a model.