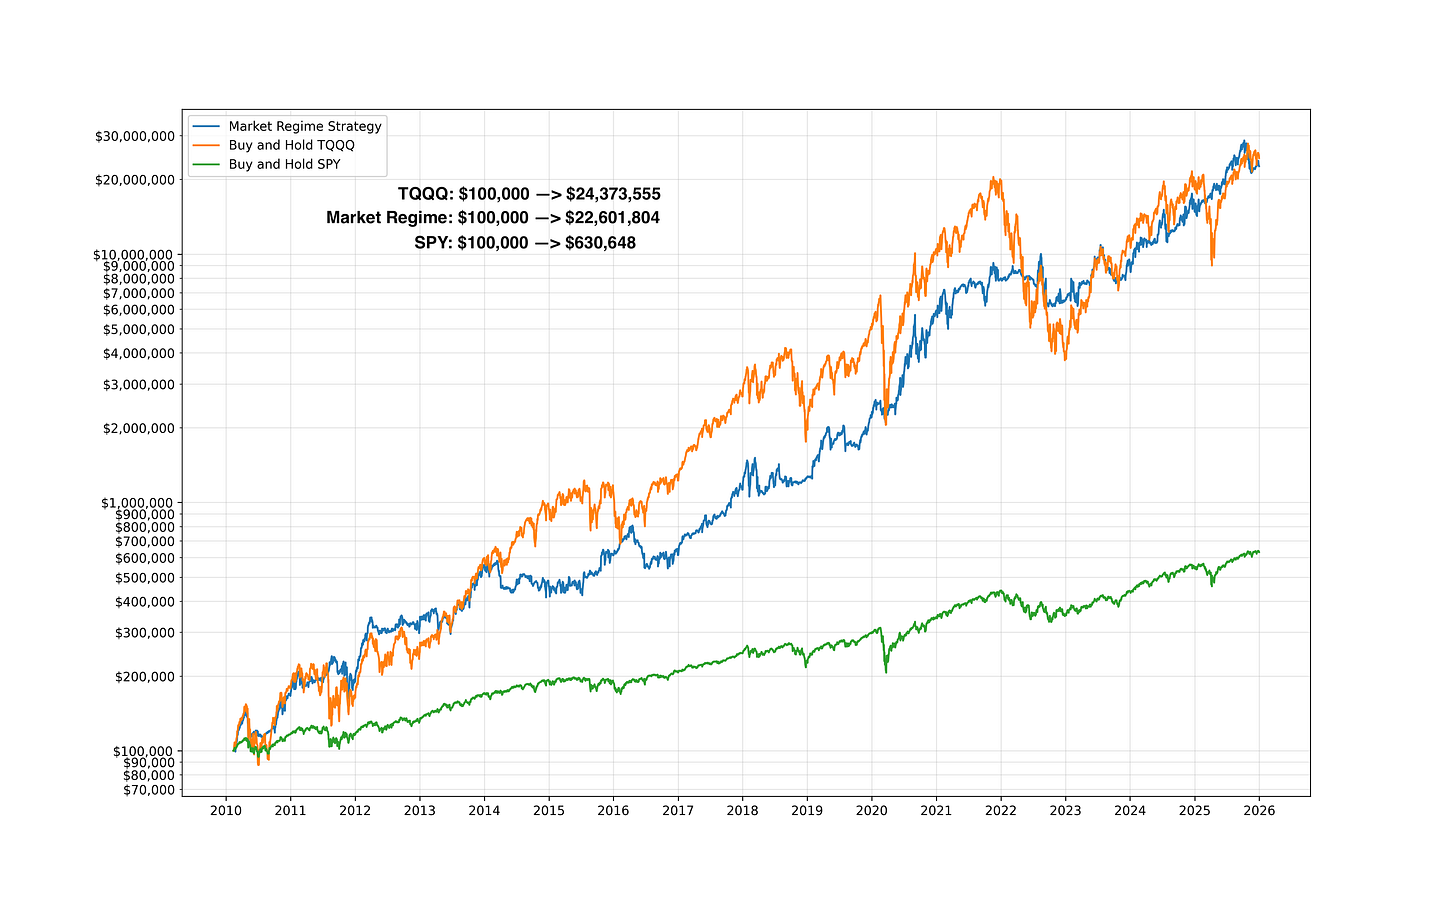
This article is part of a multi-part series where I walk through how the Market Regime model would have navigated different historical market environments. To keep things simple and transparent, I'm using TQQQ during Bullish regimes and GLD during Bearish regimes as proxies for how the system behaved in real time. Of course, past performance never guarantees future results—but understanding how a model responds across different conditions is exactly why I trade it live today. Seeing how it handled both calm and chaotic markets helps illustrate the consistency and robustness that make this approach so powerful.
In case you missed it, here's links to the entire series:
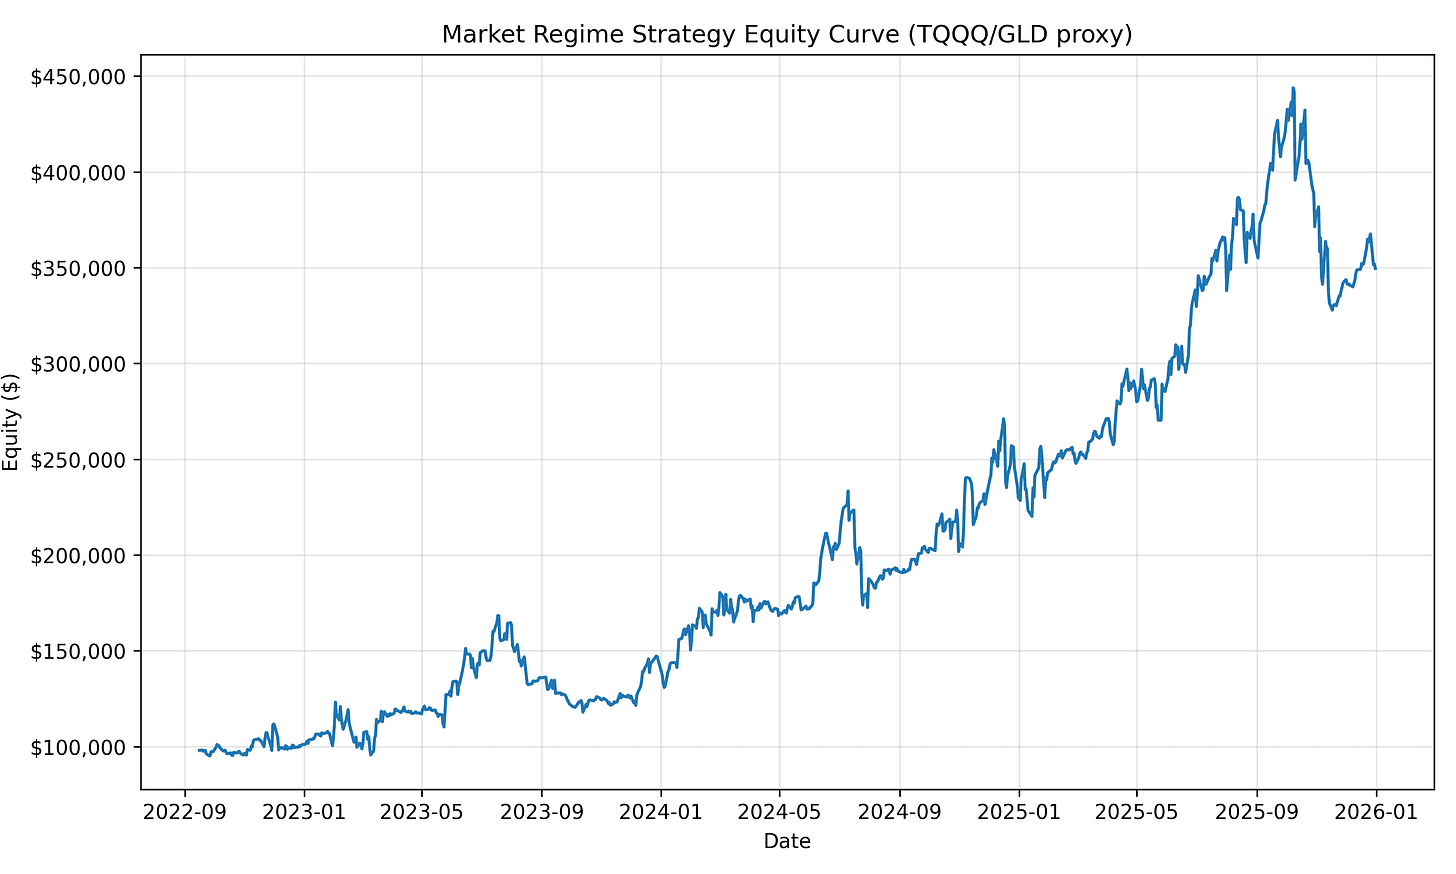
This installment covers the period from September 16, 2022 through the present, a stretch defined by violent macro transitions rather than clean, linear trends. Inflation peaked. The Federal Reserve executed the fastest hiking cycle in decades. Bond markets broke. Artificial intelligence triggered one of the most concentrated equity rallies in history. And by early 2025, global markets were once again destabilized — this time by renewed U.S. trade tariff escalation under a second Trump administration.
Across all of it, the Market Regime model followed the same rules it always has: risk-on when leadership is strong, risk-off when it deteriorates.
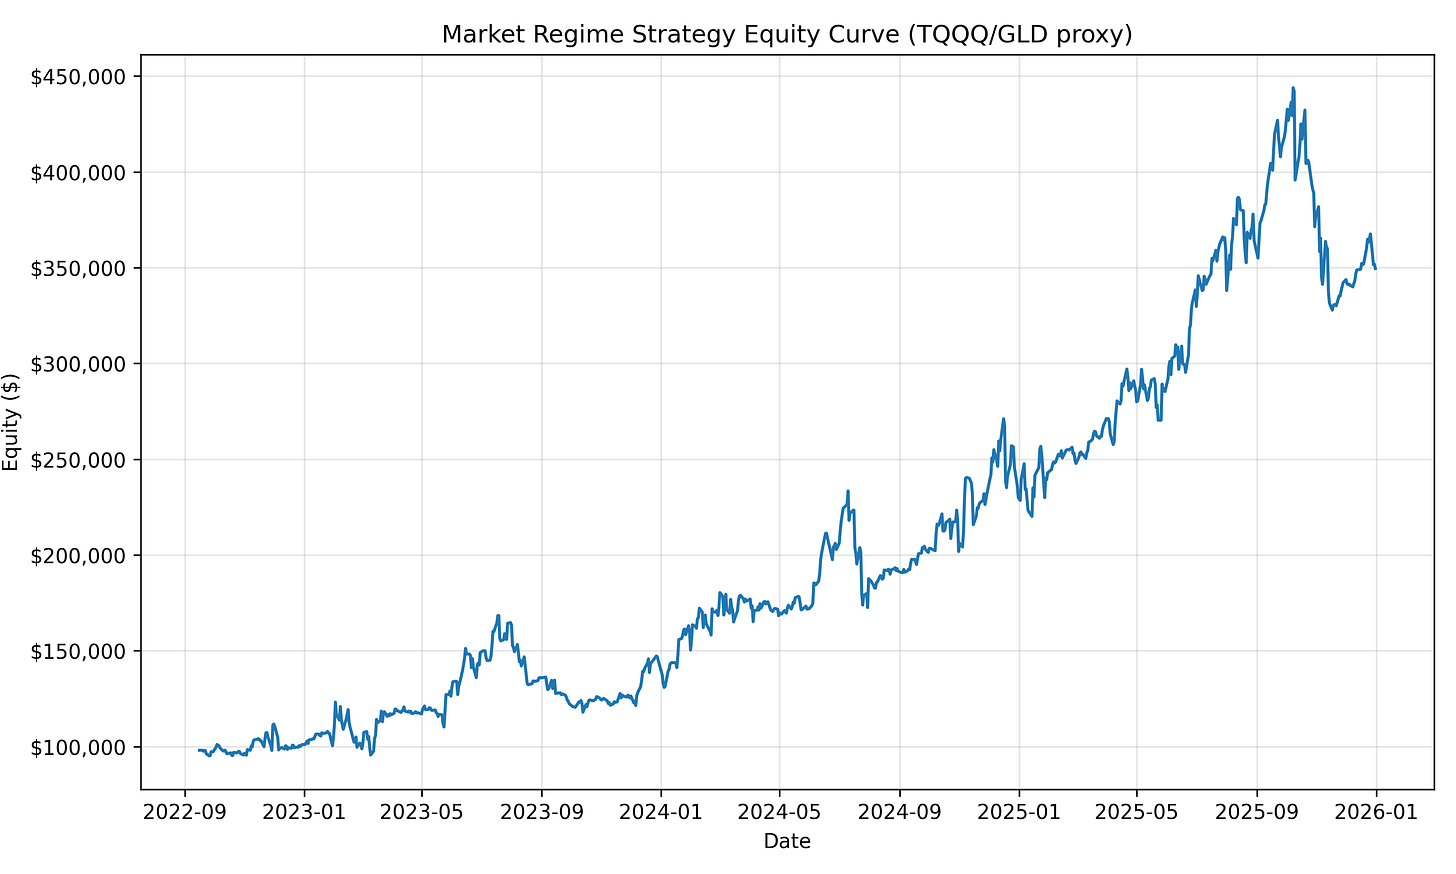
Over this period, using TQQQ during Bullish regimes and GLD during Bearish regimes, the model produced:
- Total Return: 256.5%
- CAGR: 47.15%
- 21 trades spanning one of the most complex macro backdrops in modern history
This was not a smooth environment — but it was a revealing one.
Phase 1 — Late 2022: Inflation Peak and Defensive Stability
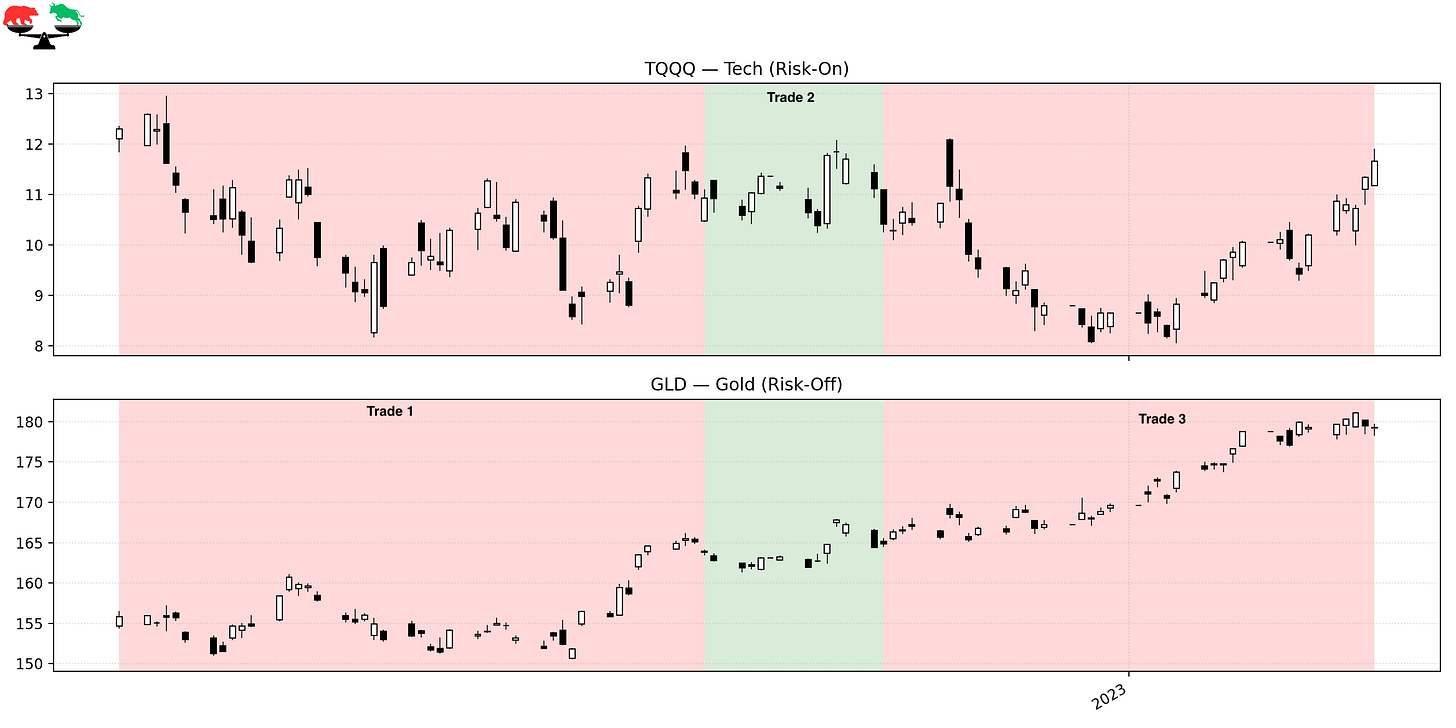
Trade 1 – Defensive Positioning as Inflation Peaks
Instrument: GLD Start: 9/16/22 End: 11/17/22 Length: 62 days Return: +5.18%
By September 2022, markets were still reeling from runaway inflation and relentless Fed tightening. Equity leadership was fractured, real yields were volatile, and recession fears dominated. The regime correctly stayed Bearish, holding GLD as markets searched for a policy inflection. Gold benefited from growing expectations that inflation had peaked, even as equities remained under pressure.
Trade 2 – A Premature Pivot Rally
Instrument: TQQQ Start: 11/17/22 End: 12/6/22 Length: 19 days Return: –4.76%
A softer CPI print triggered hopes of an imminent Fed pivot, sending equities higher. The regime flipped Bullish — but the move lacked structural support. Financial conditions were still tight, earnings estimates continued to fall, and liquidity remained constrained. This trade reflects a common early-cycle failure: markets rallying on hope before leadership is truly established.
Trade 3 – Back to Defense as Reality Sets In
Instrument: GLD Start: 12/6/22 End: 1/27/23 Length: 52 days Return: +8.72%
As markets reassessed the likelihood of sustained restrictive policy, risk assets weakened again. The regime rotated back into GLD, which performed well as volatility rose and equities struggled to regain traction. This period reinforced that the macro regime had not yet turned — despite improving inflation data.
Phase 2 — Early 2023: Leadership Emerges and the First Real Turn
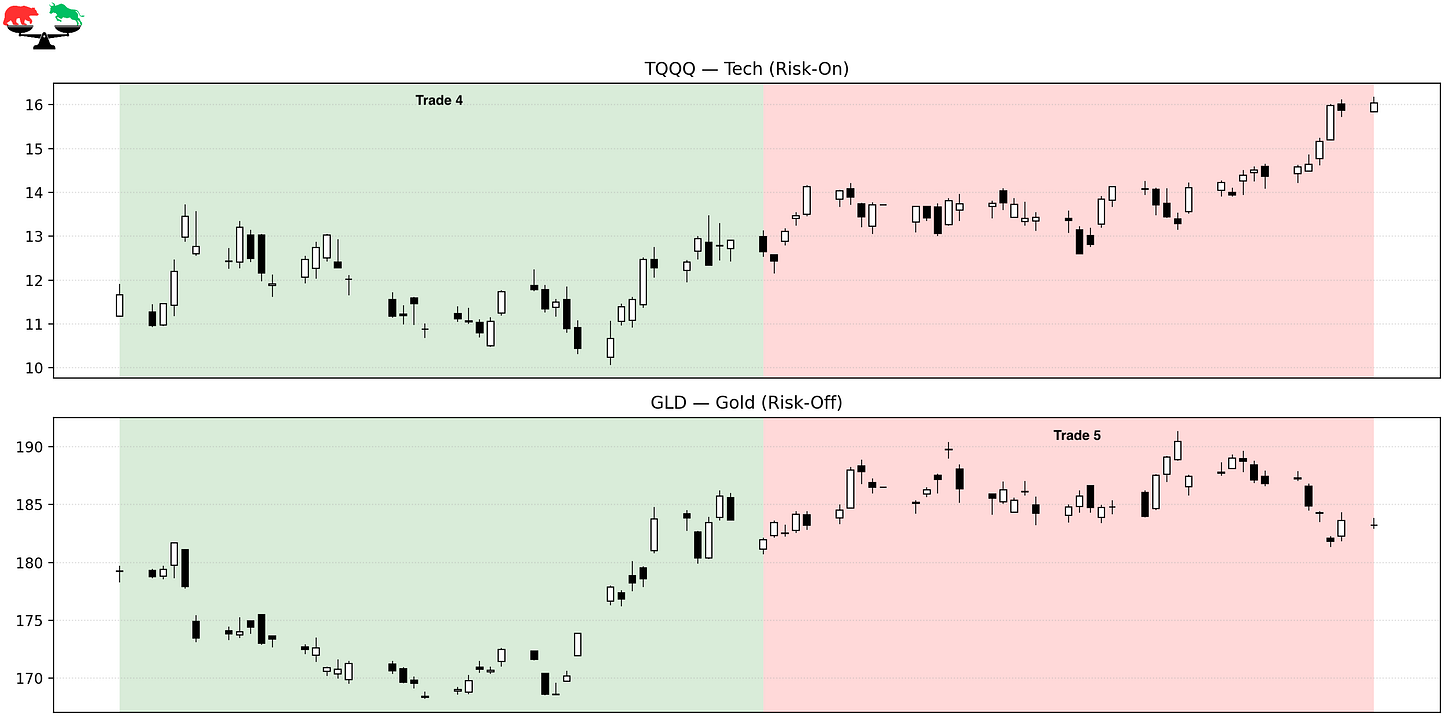
Trade 4 – Inflation Retreat and Leadership Emergence
Instrument: TQQQ Start: 1/27/23 End: 3/27/23 Length: 59 days Return: +8.40%
By early 2023, inflation was clearly decelerating and leadership began to stabilize in growth equities. Markets stopped reacting violently to rate hikes, and relative strength improved materially. This trade marked the first sustainable Bullish regime of the post-2021 cycle.
Trade 5 – Banking Stress and Defensive Reset
Instrument: GLD Start: 3/27/23 End: 5/22/23 Length: 56 days Return: +0.69%
The regional banking crisis abruptly reintroduced systemic risk. Liquidity concerns flared, volatility spiked, and leadership deteriorated. The regime responded by rotating defensively, reducing exposure during a period where surface-level calm masked growing instability.
Phase 3 — Mid-2023: AI Leadership and a Clean Trend
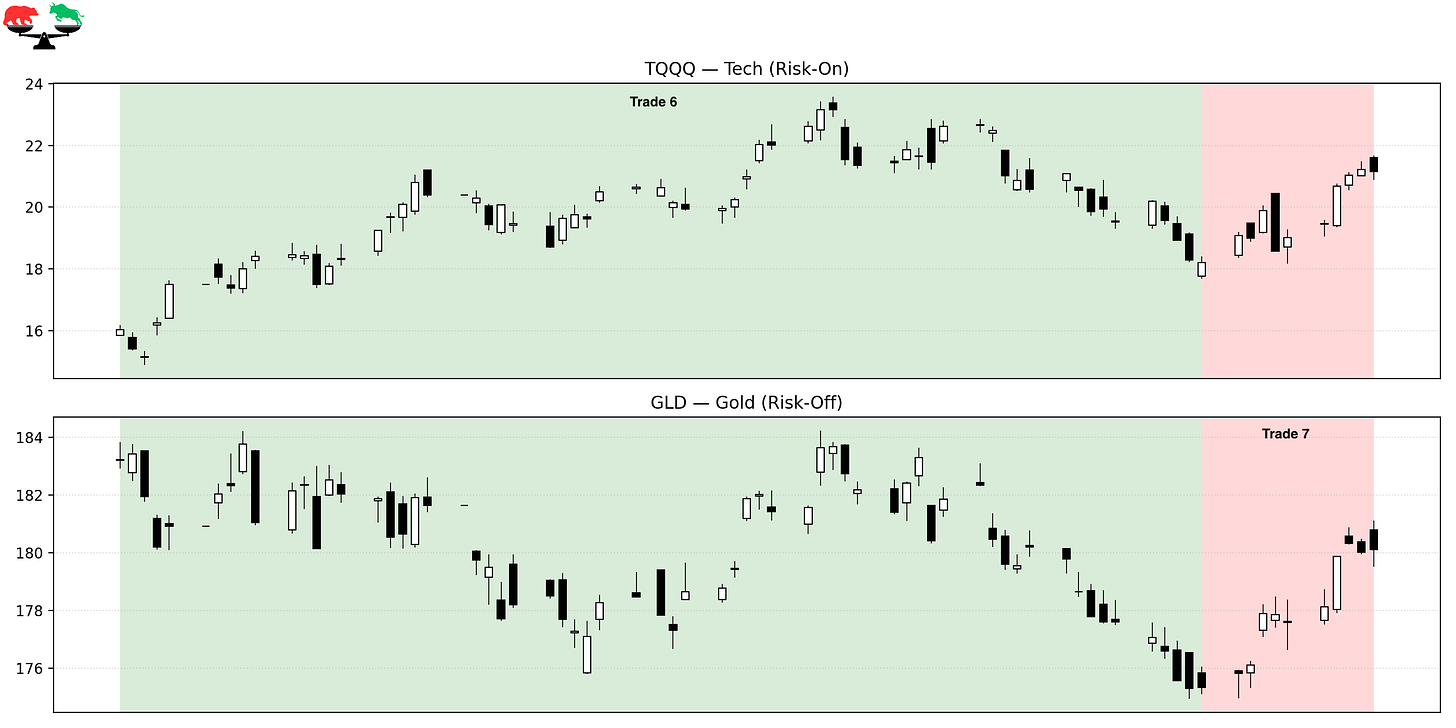
Trade 6 – The AI-Led Melt-Up
Instrument: TQQQ Start: 5/22/23 End: 8/18/23 Length: 88 days Return: +13.50%
This trade captured the heart of the AI-driven equity surge. Mega-cap tech dominated, volatility collapsed, and breadth expanded just enough to sustain momentum. The regime stayed Bullish throughout, allowing participation in one of the most powerful thematic rallies of the decade.
Trade 7 – Late-Summer Consolidation
Instrument: GLD Start: 8/18/23 End: 9/1/23 Length: 14 days Return: +2.73%
As the AI rally cooled, leadership softened and markets entered a brief digestion phase. The regime stepped defensively as momentum waned.
Phase 4 — Late 2023: Churn, Whipsaws, and Structural Stress
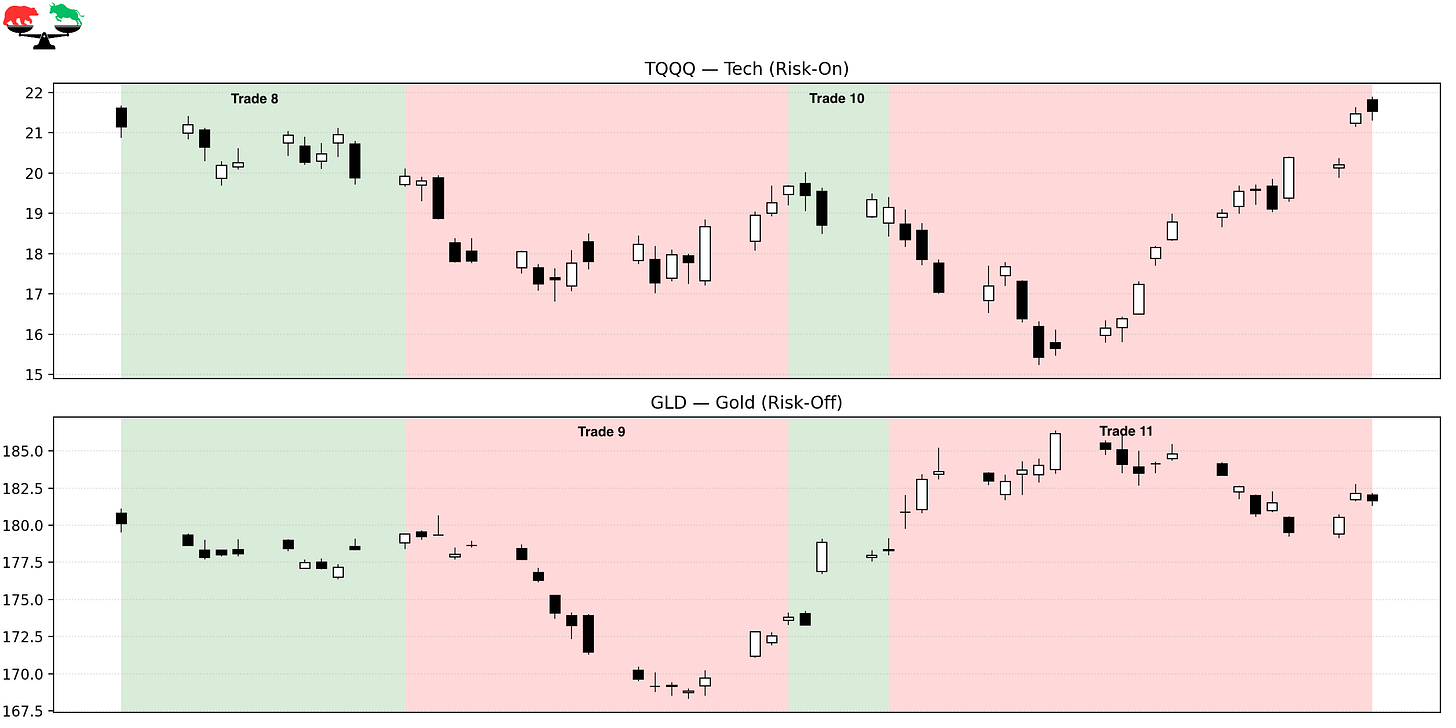
Trade 8 – Yield Shock Breaks the Trend
Instrument: TQQQ Start: 9/1/23 End: 9/18/23 Length: 17 days Return: –5.79%
Treasury yields surged to multi-decade highs, tightening financial conditions abruptly. Growth stocks sold off sharply, and the Bullish regime failed quickly.
Trade 9 – Defensive During the Bond Market Breakdown
Instrument: GLD Start: 9/18/23 End: 10/11/23 Length: 23 days Return: –3.12%
Although gold declined modestly, the defensive posture avoided far worse losses in equities as rates volatility destabilized risk assets globally.
Trade 10 – Another Failed Bullish Attempt
Instrument: TQQQ Start: 10/11/23 End: 10/17/23 Length: 6 days Return: –2.64%
Markets attempted a reflex rally as yields paused — but leadership remained weak. The regime flipped as designed, then quickly exited as the rally failed.
Trade 11 – Stabilization Ahead of the Breakout
Instrument: GLD Start: 10/17/23 End: 11/15/23 Length: 29 days Return: +1.88%
As yields peaked and volatility subsided, the regime stayed defensive, waiting for confirmation. This patience set up the next major move.
Phase 5 — Late 2023 to Early 2024: Breakout and Acceleration
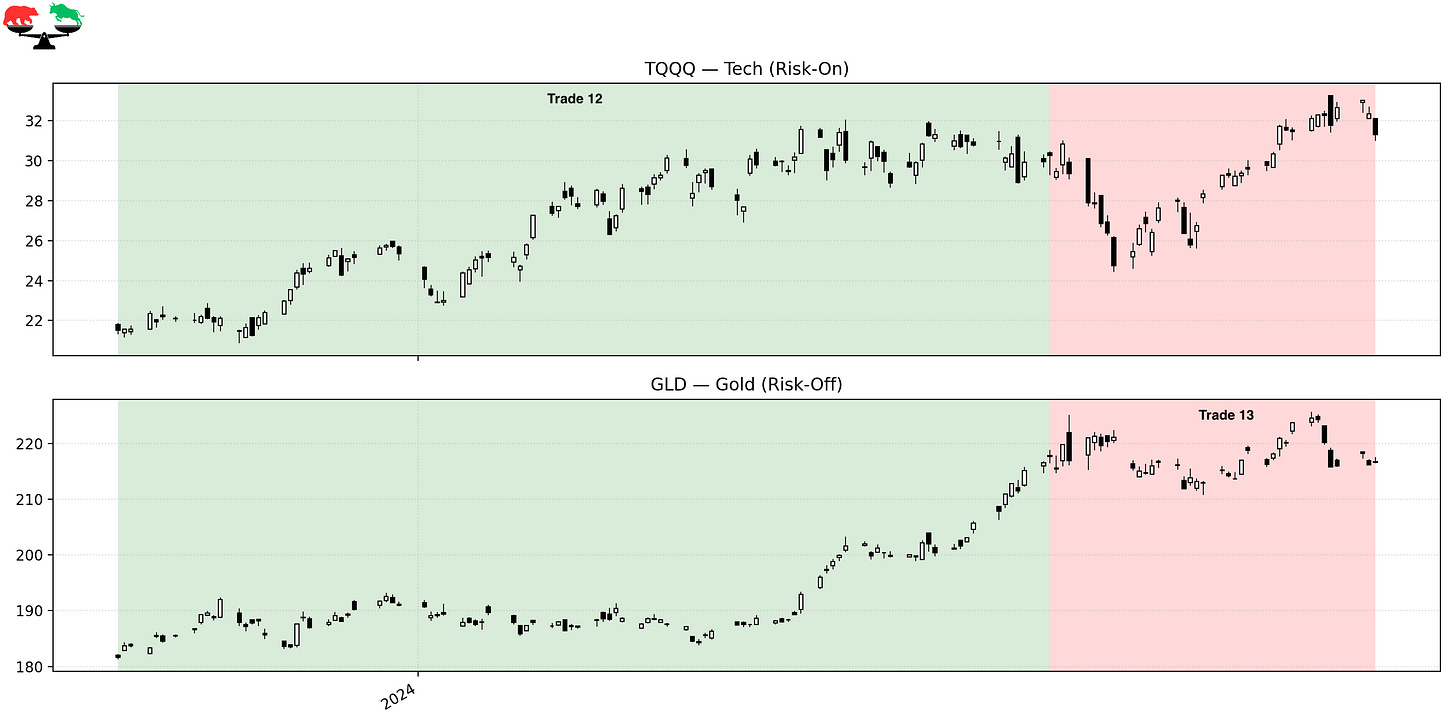
Trade 12 – The Post-Yield Peak Explosion
Instrument: TQQQ Start: 11/15/23 End: 4/9/24 Length: 146 days Return: +40.55%
Falling yields, easing financial conditions, and renewed earnings optimism ignited a powerful rally. This was one of the cleanest trend environments of the entire series, and the regime stayed Bullish throughout, capturing a massive portion of the move.
Trade 13 – Digesting Gains
Instrument: GLD Start: 4/9/24 End: 5/30/24 Length: 51 days Return: –0.51%
Markets paused after the explosive advance, consolidating amid mixed macro signals. The defensive rotation reduced volatility during this digestion phase.
Phase 6 — Mid-2024 to Present: Expansion and Volatility
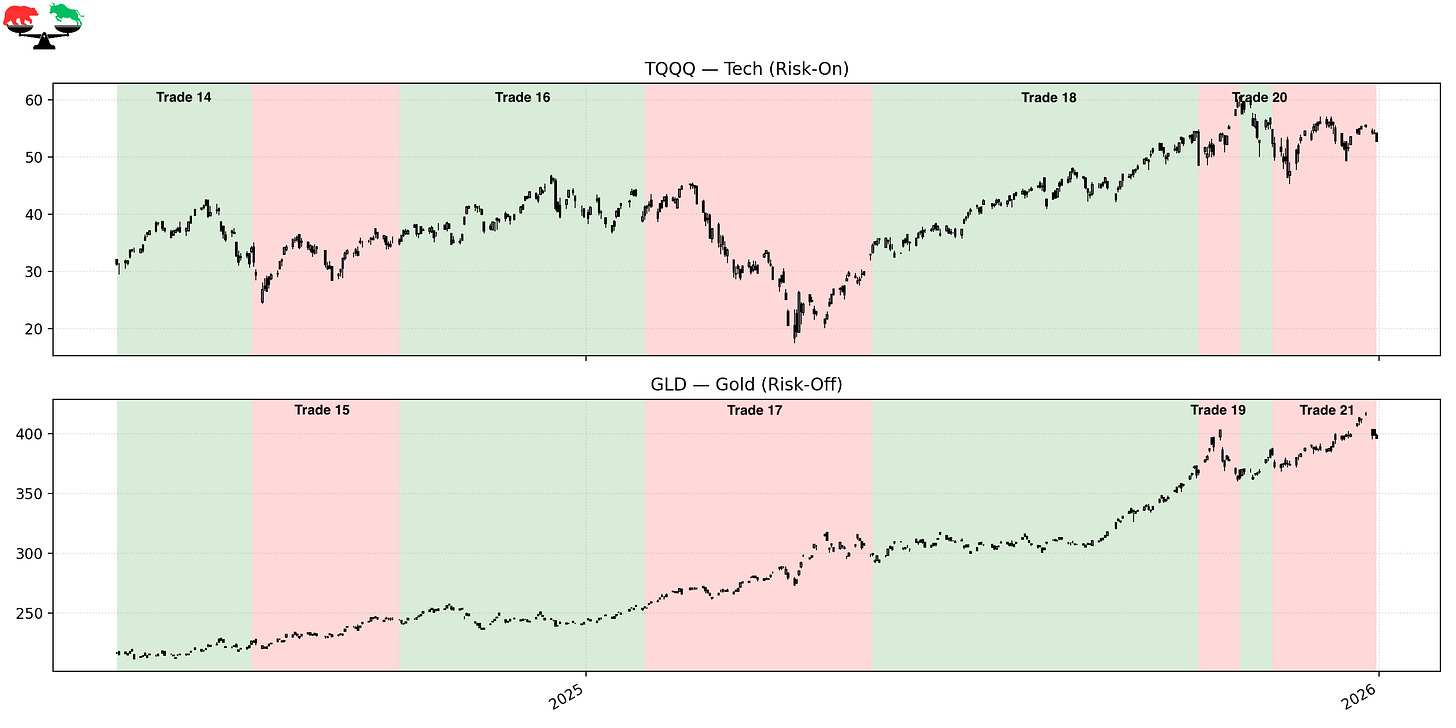
Trade 14 – Bullish Continuation
Instrument: TQQQ Start: 5/30/24 End: 7/31/24 Length: 62 days Return: +9.07%
Risk-on leadership returned as markets resumed higher, supported by resilient growth and improving sentiment.
Trade 15 – Gold Breakout Amid Rising Geopolitical Risk
Instrument: GLD Start: 7/31/24 End: 10/7/24 Length: 68 days Return: +7.78%
Gold broke out decisively as geopolitical risks increased and global monetary divergence widened. The regime correctly stayed defensive while equities churned.
Trade 16 – Renewed Expansion Phase
Instrument: TQQQ Start: 10/7/24 End: 1/28/25 Length: 113 days Return: +18.75%
Markets entered another strong expansion phase, driven by improving growth expectations and sustained leadership.
Trade 17 – Trade Tariffs and Defensive Rotation
Instrument: GLD Start: 1/28/25 End: 5/13/25 Length: 105 days Return: +17.35%
Early 2025 brought renewed U.S. trade tariffs under Trump, reintroducing global growth uncertainty and destabilizing equity leadership. The regime rotated defensively as volatility rose and markets struggled to price the long-term impact of escalating trade friction. Gold benefited meaningfully during this period.
Trade 18 – One More Bullish Push
Instrument: TQQQ Start: 5/13/25 End: 10/10/25 Length: 150 days Return: +40.40%
As markets adjusted to the new trade regime, equities staged another powerful advance. The model participated fully once leadership reasserted itself.
Trade 19 – Short Defensive Reset
Instrument: GLD Start: 10/10/25 End: 10/29/25 Length: 19 days Return: –1.66%
A brief defensive shift as volatility spiked and momentum weakened.
Trade 20 – Sharp Bullish Failure
Instrument: TQQQ Start: 10/29/25 End: 11/13/25 Length: 15 days Return: –13.22%
A fast reversal late in the cycle produced a sharp but contained loss — a reminder that regime shifts can happen quickly.
Trade 21 – Year-End Defensive Positioning
Instrument: GLD Start: 11/13/25 End: 12/31/25 Length: 48 days Return: +6.62%
The model ended the period defensively as leadership weakened again, preserving capital into year-end.
Final Thoughts
Here's a recap of the trades taken during this period:
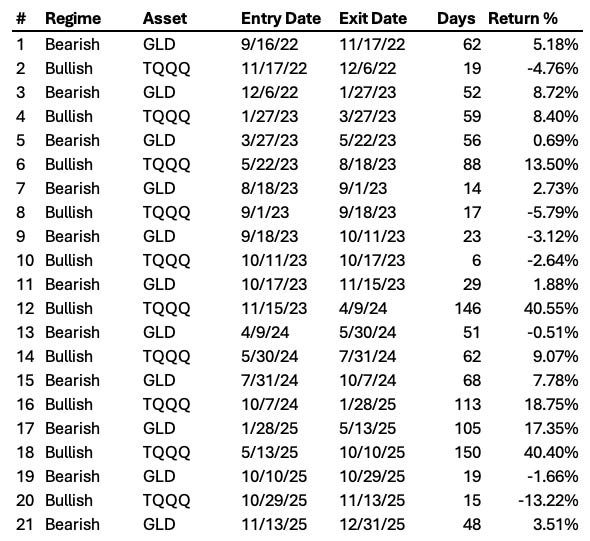
From inflation shock to AI euphoria, bond market stress, and renewed trade wars, this period tested every assumption traders tend to rely on. The Market Regime model did not attempt to predict outcomes — it reacted to leadership as it evolved.
Across this stretch, it delivered strong 256.5% total return and a 47.15% CAGR by doing three things consistently:
- Pressing risk only when leadership was real
- Stepping aside during instability
- Remaining completely agnostic to narrative
This is what systematic discipline looks like in the real world.
These historical reports show how the model handled the past. Paid subscribers get to see how it handles the present. If you want the same clarity in your trading today that this model brought to 2022-2025, join the paid community and follow along in real time.